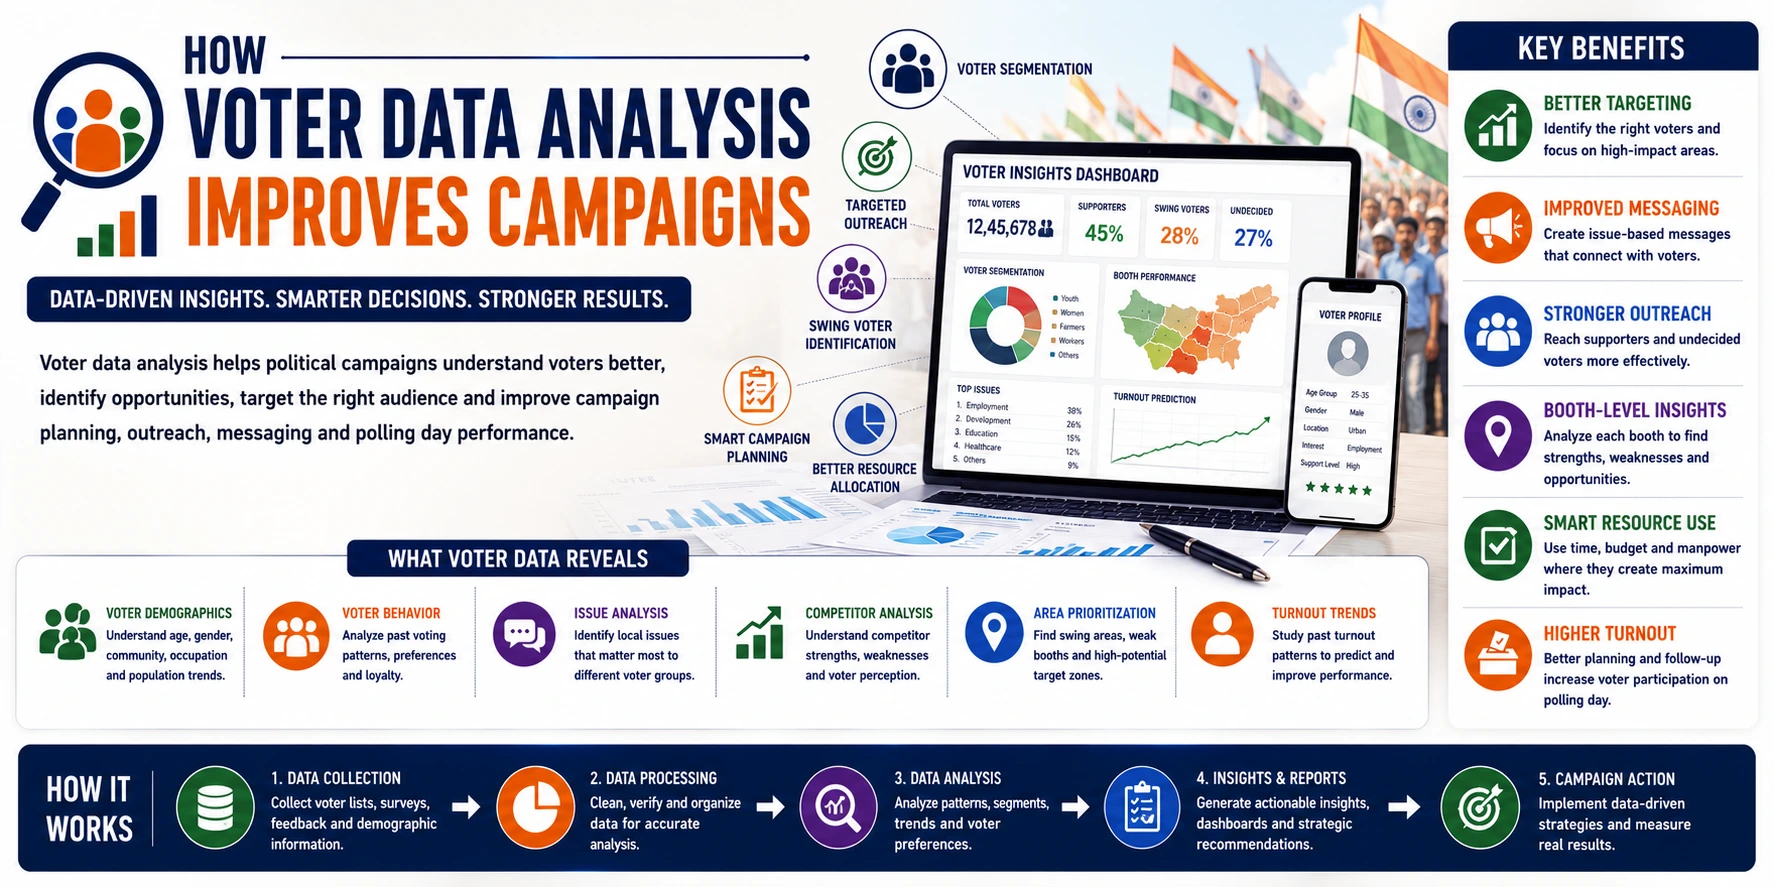
Modern election campaigns generate and use large volumes of information. Electoral rolls, historical election results, polling-area data, political surveys, constituency research, field reports and campaign activity reports can all provide useful information when they are organized and interpreted correctly. Voter Data Analysis helps transform these scattered datasets into structured Election Intelligence. Instead of relying only on assumptions, campaign management teams can use verified aggregate data to understand constituency structure, historical electoral trends, local issues, research coverage, campaign operations and changing conditions on the ground.
What is Voter Data Analysis?
Voter Data Analysis is the systematic process of collecting, cleaning, organizing, comparing and interpreting election-related information.
Depending on the research objective, it can combine:
- Electoral-roll information
- Constituency and polling-area geography
- Historical election results
- Historical turnout
- Vote-share information
- Winning-margin data
- Political survey findings
- Constituency research
- Field reports
- Campaign activity data
The objective is to turn raw information into organized analysis, dashboards, reports and research inputs that improve the quality of campaign planning and management.
For a detailed explanation, read What is Voter Data Analysis?
Why Voter Data Analysis is Important for Campaigns
Election campaigns involve multiple teams, locations, research activities, communication channels and operational decisions. Without structured information, campaign managers may find it difficult to maintain a consistent picture of the constituency.
Voter data analysis can support:
- Constituency understanding
- Historical election analysis
- Booth-level aggregate research
- Turnout and vote-share analysis
- Local issue research
- Survey-data integration
- Field-operation planning
- Resource coordination
- Campaign monitoring
- Management reporting
The value of election data does not come simply from collecting more information. Its real value comes from verification, organization, comparison, interpretation and responsible use . A smaller, well-structured and reliable dataset can often be more useful than a large collection of inaccurate or poorly documented information.
How Voter Data Analysis Improves Campaign Management
Better Research
Organizes electoral, historical, geographic and survey information into a consistent research framework.
Constituency Understanding
Provides a structured view of wards, polling areas, localities, historical results and local conditions.
Issue Intelligence
Integrates political surveys and field research to identify recurring public issues at aggregate geographic levels.
Operational Planning
Helps campaign managers understand where field research, coordination or operational attention is required.
Monitoring
Dashboards and structured reports make campaign activity and research progress easier to review.
Management Reporting
Converts complex information into concise charts, maps, summaries and analytical reports.
How Campaign Voter Data Analysis Works
Improving Constituency Understanding Through Data
A constituency is not a single uniform unit. It can contain different wards, villages, urban areas, polling areas, infrastructure conditions and local public issues.
Data analysis can bring these layers together and help create a structured constituency profile covering:
- Constituency geography
- Ward and polling-area structure
- Electorate size
- Historical results
- Turnout history
- Vote-share trends
- Local public issues
- Infrastructure information
- Political survey findings
- Field-research coverage
Learn more: What is Constituency Profiling?
How Booth-Level Data Supports Campaign Planning
Polling-area and booth-level aggregate data provides a more detailed geographic view of historical election patterns.
Analysis can include:
- Registered electorate totals
- Historical turnout
- Historical vote share
- Winning margins
- Changes between election cycles
- Polling-area geography
- Field-research coverage
- Campaign activity reporting
Booth-level election results are aggregate results. They do not reveal how an individual elector voted.
Polling-station numbers, boundaries and voter allocation can also change between elections. Historical booth comparisons therefore require careful verification.
Explore: Booth Management
Campaign Analysis vs Official Polling Administration
Campaign-Side Analysis
May include electoral research, historical result analysis, geographic mapping, field coordination, survey research and internal campaign reporting.
Official Election Administration
Electoral rolls, official polling-station administration, voting procedures, polling personnel, election security and formal counting are functions of the relevant election authorities.
Using Historical Election Data in Campaign Research
Previous election results provide important context for understanding how a constituency has changed over time.
Historical analysis may compare:
- Vote share
- Winning margins
- Turnout
- Party performance
- Candidate performance
- Constituency-level changes
- Polling-area aggregate changes
- Alliance and candidate changes
Historical data provides context rather than certainty. Political conditions, candidates, alliances and public issues can change significantly between elections.
Election Trend Analysis and Campaign Planning
Election Trend Analysis compares electoral indicators across elections or research periods to identify patterns.
These may include:
- Vote-share movement
- Turnout movement
- Margin changes
- Party performance trends
- Candidate changes
- Survey-wave changes
Trends should be interpreted as observed patterns rather than guaranteed predictions of future election results.
Local Issue Mapping Through Data and Research
Election campaigns often receive large volumes of information about local concerns through surveys, public meetings, field teams and constituency research.
Structured issue mapping can organize recurring concerns such as:
- Roads and transport
- Water supply
- Electricity
- Employment
- Education
- Healthcare
- Agriculture
- Public infrastructure
- Civic services
- Local development
Issues can be summarized geographically and by research frequency without building unnecessary individual political profiles.
Integrating Political Surveys with Voter Data
Historical electoral data explains previous election outcomes, but it cannot by itself explain current public opinion.
Political surveys can add research on:
- Public issue priorities
- Candidate awareness
- Candidate evaluation
- Government performance assessment
- Public satisfaction
- Stated voting intention
- Changes between survey waves
Survey findings should be interpreted according to their sampling, questionnaire, fieldwork and methodological limitations.
Explore: Political Survey Services
How Data Supports Campaign Planning
Campaign managers need to coordinate research, field teams, meetings, communication activities, reporting and other operational requirements.
Data systems can help management understand:
- Which areas have completed field research
- Where research coverage remains incomplete
- Which local issues are being reported frequently
- Where campaign activities have been completed
- Which teams have pending operational tasks
- How survey findings are changing over time
- How campaign resources are being utilized
- What information requires management review
Resource Planning Through Campaign Data
Large election campaigns may involve hundreds of activities across multiple geographic areas.
Structured operational data can support planning for:
- Field-research teams
- Campaign coordinators
- Volunteer teams
- Public meetings
- Research schedules
- Communication material
- Travel and logistics
- Reporting requirements
Resource planning should be based on legitimate campaign-operational requirements rather than individualized political profiling.
Connecting Voter Data with Field Research
Database analysis and field research should complement each other.
Field teams can help verify:
- Local geography
- Polling-area mapping
- Public infrastructure
- Recurring public issues
- Campaign activity completion
- Research coverage
- Local organizational information
Field observations should be reported systematically so that campaign management can distinguish verified information from informal assumptions.
Data and Door-to-Door Campaign Operations
Data systems can support the operational management of door-to-door campaign activities without requiring individual political classification.
Campaign managers may track:
- Assigned geographic areas
- Field-team routes
- Areas covered
- Pending areas
- General public issues reported
- Campaign material requirements
- Field-team activity status
- Operational incidents
Public interaction should remain respectful, and citizens should be free to decline engagement.
How Research Data Supports Political Communication
Political surveys, public issue studies and constituency research can help campaign organizations understand what information requires clear public explanation.
Research can support:
- Issue documentation
- Fact preparation
- Public-information materials
- Speech research
- Media briefing preparation
- Frequently asked questions
- Public statement verification
Research should support clear and factual public communication rather than unnecessary personal targeting based on sensitive characteristics.
Role of Data in Digital Campaign Management
Election research can also support the management of official digital campaign communication.
Data can help teams organize:
- Public issue information
- Campaign event updates
- Official announcements
- Website information
- Social-media content calendars
- Content performance reports
- Publicly visible response trends
- Digital asset libraries
Digital analytics should be used with appropriate privacy, platform-policy and election-compliance controls.
Explore: Digital Promotion Services
Voter Research and Candidate Public Image
Properly designed political surveys and public research can provide aggregate information about candidate awareness and public evaluations.
Research may examine:
- Candidate awareness
- Public knowledge of candidate background
- Perceptions of accessibility
- Evaluations of public work
- Issue awareness
- Communication clarity
Such findings can help identify factual information that needs clearer public communication while maintaining authenticity and transparency.
Role of Dashboards and Campaign Reports
Dashboards make large volumes of campaign and electoral information easier for management teams to review.
A campaign intelligence dashboard may include:
- Electorate statistics
- Historical vote share
- Historical turnout
- Winning-margin analysis
- Survey findings
- Issue summaries
- Field-research coverage
- Campaign activity status
- Team reporting status
- Data-quality indicators
Dashboards should show the source and context of important indicators so that visual presentation does not create false certainty.
Daily and Periodic Campaign Reporting
Structured reporting helps campaign management understand what has happened across research and operational teams.
Reports may include:
- Field activities completed
- Research areas covered
- Pending operational tasks
- Public issues reported
- Survey progress
- Team coordination updates
- Digital communication activity
- Operational incidents
- Data-quality concerns
Voter Data Analysis and War Room Management
An election war room can act as a central coordination point for research, campaign operations, field reports, media monitoring, digital communication and management reporting.
A data-supported war room may integrate:
- Constituency research
- Political survey reports
- Historical election data
- Field activity reports
- Issue tracking
- Digital monitoring
- Media monitoring
- Campaign task status
- Management dashboards
Technology Used in Campaign Data Analysis
Modern campaign-data systems can make electoral information easier to organize, validate, visualize and report.
Technology may support:
- Centralized databases
- Mobile field applications
- Survey-data collection
- Geographic mapping
- Data validation
- Dashboard reporting
- Campaign task management
- Document management
- Access controls
- Audit trails
AI-Assisted Election Data Analysis
AI-assisted tools can help process and organize large election datasets, but their output requires human review.
Possible uses include:
- Data classification
- Duplicate detection assistance
- Anomaly detection
- Trend comparison
- Research summarization
- Issue categorization
- Report assistance
- Data-quality flagging
AI should not be treated as a guaranteed predictor of individual political behaviour or election outcomes.
Privacy and Data Governance
Election-related data can involve personal or sensitive information, making responsible data governance essential.
Good practices include:
- Use appropriate and lawful data sources
- Define the purpose before collecting information
- Collect only necessary data
- Avoid unnecessary sensitive personal profiling
- Use aggregate analysis where appropriate
- Restrict access to authorized personnel
- Use secure storage and transfer
- Maintain access controls
- Maintain appropriate audit records
- Apply data-retention controls
Data Quality Determines Analytical Quality
Advanced software cannot compensate for poor-quality source data.
Campaign-data systems should check:
- Source reliability
- Source date
- Dataset version
- Duplicate records
- Missing information
- Geographic consistency
- Historical comparability
- Survey methodology
- Field verification
- Analytical assumptions
Role of Data During the Polling Period
During the polling period, campaign data systems can continue to support permitted internal campaign administration and operational coordination.
Depending on applicable rules, this may include:
- Internal team coordination
- Campaign-office reporting
- Permitted logistics management
- Coordinator status updates
- Operational incident reporting
- Compliance reminders
- Management reporting
Campaign activities during restricted periods and around polling stations must comply with applicable election laws, Election Commission directions and local administrative requirements.
Official polling administration, official turnout reporting, voting procedures, polling personnel and election security remain the responsibility of the relevant election authorities.
Benefits of Voter Data Analysis for Election Campaigns
- Better organized election information
- Improved constituency understanding
- Stronger historical analysis
- Better booth-level aggregate research
- Improved issue documentation
- Better survey integration
- More structured field planning
- Improved campaign coordination
- Clearer management dashboards
- Better operational monitoring
- Improved data-quality control
- More evidence-based campaign management
Challenges in Campaign Voter Data Analysis
Outdated Data
Old datasets may not reflect current electoral-roll or polling-area structures.
Duplicate Records
Duplicate and inconsistent records can distort analysis and reporting.
Boundary Changes
Polling-area or geographic changes can make historical comparison difficult.
Field Verification
Informal field information may require verification before being used in management reports.
Privacy & Security
Poor controls can create unnecessary privacy, confidentiality and security risks.
Overinterpretation
Aggregate patterns can be misleading when interpreted as individual behaviour or guaranteed future outcomes.
Best Practices for Campaign Data Analysis
- Define research questions clearly
- Use reliable data sources
- Record source dates and versions
- Clean data before analysis
- Verify geographic mapping
- Document analytical assumptions
- Use aggregate analysis where appropriate
- Avoid unnecessary sensitive personal profiling
- Protect database access
- Maintain audit trails
- Review dashboards regularly
- Explain limitations in reports
How Professional Voter Data Analysis Services Support Campaigns
Large election campaigns may involve multiple constituencies, thousands of polling areas, large electoral datasets, political surveys, field teams and continuous reporting.
Professional election-data support may include:
- Electoral data processing
- Data cleaning and verification
- Constituency-wise data structuring
- Booth-level aggregate analysis
- Historical election analysis
- Turnout analysis
- Vote-share analysis
- Political survey integration
- Field-research integration
- GIS and mapping
- Campaign dashboards
- Management reporting
- Data governance
- Security and access management
Explore: Voter Data Analysis Services
Megamind's Data-Driven Campaign Approach
Megamind combines electoral data, political research, constituency intelligence, field operations, technology and management reporting to build structured election-intelligence systems.
Our approach can follow:
Campaign Requirement → Electoral Data Collection → Data Verification → Constituency Mapping → Historical Analysis → Political Survey → Issue & Field Research → Booth-Level Aggregate Analysis → Campaign Planning → Field & Digital Operations → Monitoring → Analytical Reporting → Continuous Review
This approach helps political parties, candidates, leaders, prospective candidates, aspirants, campaign teams and political organizations manage complex campaign information through a structured research and reporting framework.
Explore Voter Data Analysis Services →Voter Data as Part of a Complete Campaign Intelligence System
Voter data analysis becomes more useful when integrated with other legitimate election-research and campaign-management functions.
Political Research → Electoral Data → Constituency Intelligence → Historical Analysis → Political Survey → Local Issue Research → Booth-Level Aggregate Analysis → Campaign Operations → Digital & Ground Coordination → Monitoring → Analytical Reporting
Different data sources answer different questions. Combining them carefully provides a more complete understanding than relying on a single dataset or assumption.
FAQs About Voter Data Analysis in Election Campaigns
1. How does voter data analysis help an election campaign?
It helps organize electoral, historical, geographic, survey and campaign-operation information into structured research and management reports.
2. What data can be used in election analysis?
Depending on the project, analysis may use appropriate electoral-roll information, historical election results, turnout, geography, political surveys, field research and campaign activity data.
3. How does data improve constituency analysis?
It brings geography, electoral history, electorate size, public issues, surveys and field research into a structured constituency-level framework.
4. What is booth-level data analysis?
It studies aggregate polling-area information such as electorate totals, historical turnout, vote share, margins and geographic patterns.
5. Can booth results show how an individual voted?
No. Booth-level results are aggregate election results and do not reveal an individual's secret ballot.
6. How do political surveys work with voter data?
Surveys provide current aggregate public-opinion research that can be compared with historical and administrative electoral information.
7. How can data improve field campaign management?
Data systems can track geographic coverage, team activities, research progress, general issue reporting and operational requirements.
8. What is the role of dashboards in election campaigns?
Dashboards summarize complex election and campaign information through charts, maps, indicators and management reports.
9. Can voter data analysis predict an election result?
Data analysis can identify historical and current patterns, but it cannot guarantee a future election outcome.
10. Can AI be used in election-data analysis?
AI can assist with data organization, anomaly detection, classification, summarization and aggregate analysis, but important conclusions require human review.
11. Why is data quality important?
Incomplete, outdated, duplicate or incorrectly mapped data can produce misleading reports and unreliable conclusions.
12. What is responsible voter-data analysis?
It uses appropriate sources, minimizes unnecessary personal information, applies security controls, favors aggregate analysis where appropriate and documents analytical limitations.
13. Does voter data analysis replace political surveys?
No. Electoral data and political surveys provide different forms of information and can complement one another.
14. How does data support campaign monitoring?
Structured reporting can show research progress, field activity, operational tasks, issue reports and other campaign management indicators.
15. Who can use professional voter data analysis services?
Political parties, candidates, leaders, prospective candidates, aspirants, political organizations and campaign teams may use professional election-data services according to their legitimate research and operational requirements.
Voter Data Analysis Strengthens Election Research and Campaign Management
Voter Data Analysis can improve election campaigns by converting scattered electoral and campaign information into structured intelligence.
Electoral data, historical results, constituency geography, booth-level aggregate information, political surveys, field research and campaign reports can together provide a clearer understanding of the electoral environment.
The strongest data-driven campaign systems focus on accuracy, verification, aggregate analysis, operational coordination, privacy, security and transparent reporting .
When voter data analysis is integrated with Political Surveys, Constituency Intelligence, Booth Management, Election Trend Analysis, Digital Communication, Field Operations and Campaign Monitoring , it can become an important part of a complete Election Intelligence Framework.