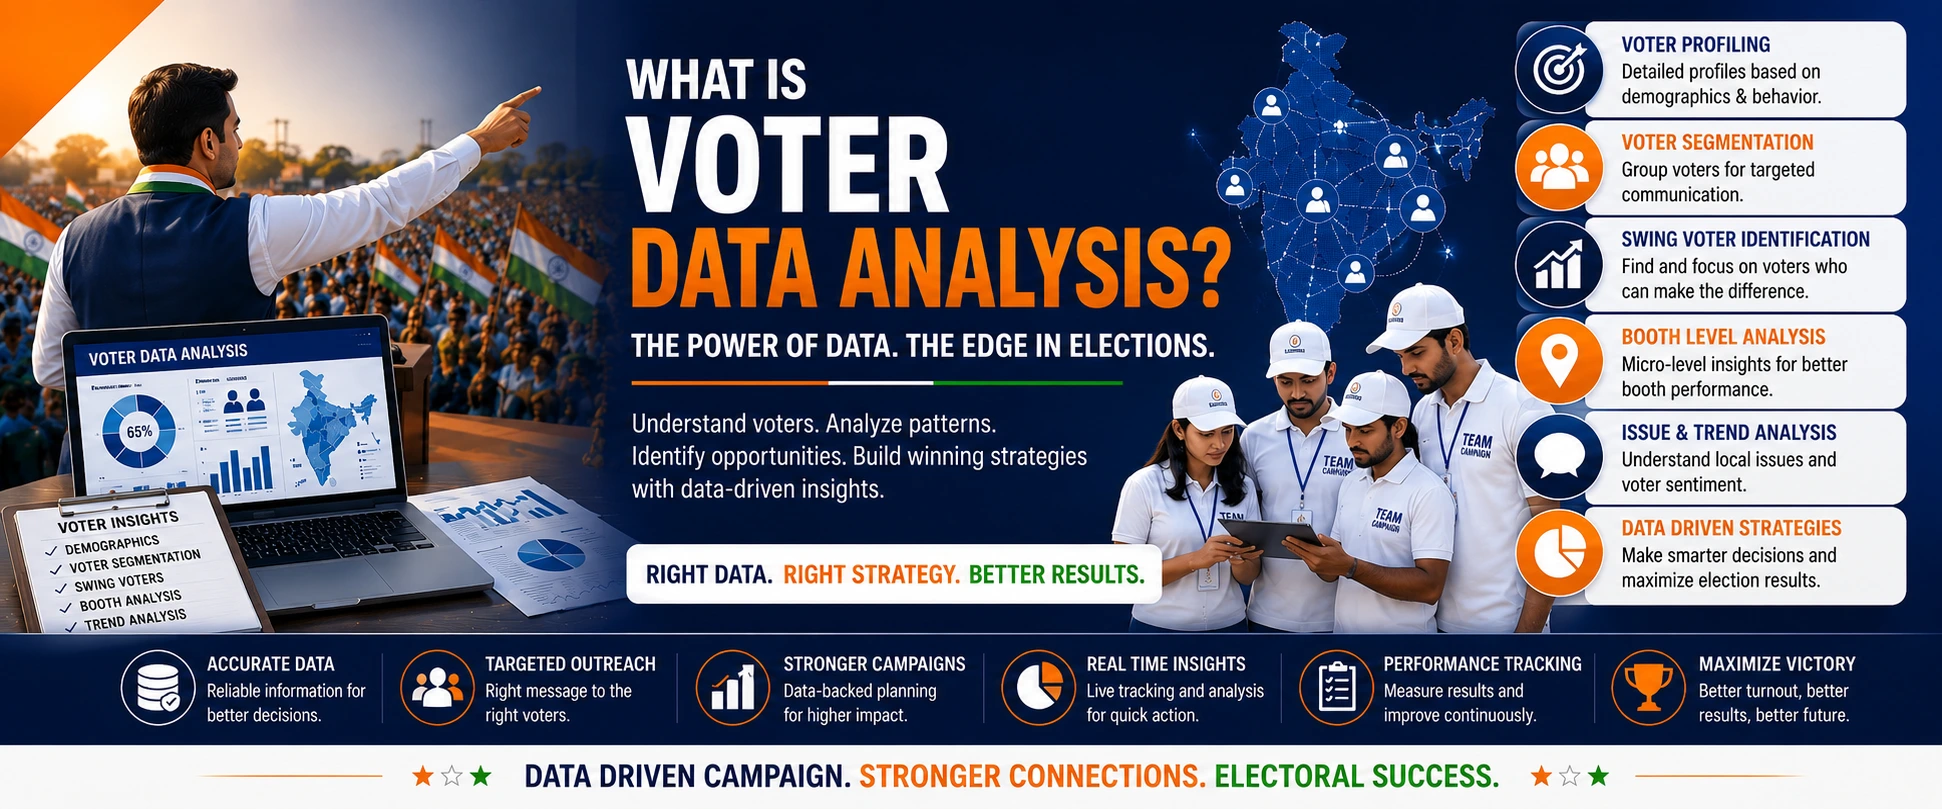
Voter Data Analysis is the structured process of organizing, validating and analyzing election-related data to understand the size, geography and historical characteristics of an electorate. In a professional election-research environment, voter data analysis can combine electoral-roll information, constituency geography, polling-area data, historical election results, turnout statistics, political survey findings and field research to create a more complete analytical picture. Its purpose should not be to infer how a particular citizen will vote. Instead, responsible voter-data analysis focuses on aggregate electoral patterns, data quality, geographic structure, historical trends and evidence-based election research .
What is Voter Data Analysis?
Voter Data Analysis is the systematic process of collecting, organizing, validating, comparing and interpreting electoral information.
Depending on the available data and research objective, analysis may examine:
- Total electorate size
- Electoral-roll changes
- Polling-area geography
- Booth-level aggregate results
- Historical turnout
- Historical vote share
- Winning margins
- Constituency-level trends
- Political survey findings
- Field research observations
The goal is to convert raw electoral information into structured research that can be reviewed through reports, dashboards, charts and geographic analysis.
Voter Data Analysis is Not Individual Vote Prediction
Electoral datasets may contain information about registered voters, polling areas or constituency structure, but that does not mean an analyst can know how a specific individual voted.
Voting is secret, and individual political preference should not be inferred merely from demographic characteristics, location or unrelated personal information.
Responsible voter-data analysis works best at an aggregate electoral and geographic level: electorate size, polling areas, historical results, turnout, survey findings and trends — not individualized political profiling.
Why Voter Data Analysis is Important
Election-related information can exist across electoral rolls, historical result files, polling-station records, spreadsheets, survey datasets and field reports.
Without structured data management, these sources can become difficult to compare or interpret.
Voter data analysis can help:
- Organize electoral data systematically
- Understand constituency geography
- Monitor changes in electorate size
- Compare historical election results
- Analyze turnout trends
- Study vote-share movement
- Support booth-level aggregate research
- Integrate political survey findings
- Improve data quality and reporting
- Support evidence-based election research
Types of Data Used in Voter Data Analysis
Electoral Roll Data
Information contained in official electoral rolls and related publicly available electoral records.
Geographic Data
Constituency, ward, polling-area, village, locality and other geographic reference information.
Historical Results
Previous election vote totals, vote share, turnout, margins and other aggregate result information.
Survey Data
Aggregate findings from properly designed political surveys, opinion polls or issue research.
Field Research
General observations about public issues, infrastructure, locality conditions and operational field research.
Administrative Data
Appropriate public information that provides context about geography, infrastructure or constituency administration.
Key Components of Voter Data Analysis
Data Collection
Gathering relevant electoral, geographic, historical and research datasets.
Data Cleaning
Identifying duplicate, incomplete, inconsistent or invalid records.
Data Structuring
Organizing information by constituency, ward, polling area or other appropriate units.
Historical Analysis
Comparing past election results, turnout, vote share and margins.
Geographic Analysis
Studying aggregate electoral information across defined geographic areas.
Survey Integration
Combining aggregate survey findings with other election research.
Quality Control
Verifying sources, consistency, geographic mapping and data completeness.
Visualization
Converting complex information into charts, maps and dashboards.
Analytical Reporting
Presenting findings, assumptions, data quality and limitations clearly.
How Voter Data Analysis Works – Step by Step
Role of Electoral Roll Data
Electoral rolls provide an important administrative foundation for understanding the registered electorate.
At an appropriate aggregate level, analysis may examine:
- Total registered electors
- Polling-area elector totals
- Changes between roll versions
- Constituency-level electorate growth
- Polling-station allocation changes
- Geographic distribution
- Data completeness
Electoral rolls are administrative records. They should not be interpreted as revealing how an individual intends to vote.
Why Data Cleaning is Important
Raw election datasets can contain formatting inconsistencies, duplicate entries, missing values or changes in geographic coding.
Cleaning procedures may include:
- Duplicate detection
- Missing-value checks
- Standardizing field formats
- Location-name normalization
- Polling-station code verification
- Historical dataset reconciliation
- Source version control
- Audit logging
Poorly cleaned data can produce misleading charts and incorrect comparisons even when the analytical software itself is functioning correctly.
Historical Election Result Analysis
Previous election results provide context for understanding long-term electoral patterns.
Historical analysis may compare:
- Party vote share
- Candidate vote share
- Winning margins
- Turnout rates
- Constituency-level performance
- Booth-level aggregate results
- Alliance changes
- Candidate changes
Historical comparisons require context because alliances, candidates, boundaries and political conditions can change between elections.
Voter Data Analysis and Vote Share
Vote share shows the percentage of valid votes received by a political party or candidate in a defined election.
Comparing vote share over time can help analysts understand aggregate electoral movement.
However, vote-share changes alone do not explain why the movement occurred. Additional political surveys, field research and contextual analysis may be needed.
Turnout Analysis
Turnout is another important aggregate electoral indicator.
Analysts can compare turnout:
- Across elections
- Across constituencies
- Across wards
- Across polling areas
- Across urban and rural electoral areas
Turnout changes should not automatically be interpreted as political support for any particular party or candidate.
Weather, administrative conditions, election competitiveness, voter roll changes and other factors can affect turnout.
Booth-Level Voter Data Analysis
Polling-area and booth-level aggregate information can provide detailed geographic context for election research.
Booth-level analysis may examine:
- Total electors
- Historical turnout
- Historical vote share
- Winning margins
- Changes between elections
- Geographic clustering
- Polling-area comparability
- Field research coverage
Booth results are aggregate data and should not be interpreted as revealing how an individual elector voted.
Polling-station numbers, boundaries and voter allocation can also change between elections, so historical mapping should be verified carefully.
Explore: Booth Management .
Campaign Data Analysis vs Official Election Administration
Election research and campaign-side data analysis should be clearly distinguished from official election administration.
Election Research
May analyze publicly available electoral data, historical results, survey findings, geographic patterns and campaign research.
Official Administration
Electoral rolls, official polling-station administration, voting procedures, polling personnel and formal election results are handled by the relevant election authorities.
Voter Data Analysis and Constituency Research
Constituency analysis can combine electoral data with geography, historical election results, infrastructure information and survey research.
A constituency research framework may include:
- Constituency boundaries
- Ward and polling-area structure
- Electorate size
- Historical vote share
- Turnout trends
- Winning-margin history
- Candidate history
- Local public issues
- Survey findings
- Infrastructure information
Political Surveys and Voter Data Analysis
Administrative and historical electoral data explains what is known about the electorate and previous election outcomes, but it does not explain every current public opinion.
Political surveys can provide additional aggregate research about:
- Public issue priorities
- Candidate awareness
- Candidate evaluations
- Government performance assessments
- Stated voting intention
- Changes between survey waves
Combining survey findings with electoral data can provide a broader research context while preserving the limitations of each source.
Explore: Political Survey Services .
Opinion Polls and Voter Data
Opinion polls are survey-based estimates of public opinion at a particular point in time.
They should not be confused with electoral-roll data or official election results.
Electoral Data
Describes registered electors, geography and historical aggregate election information.
Opinion Poll
Measures responses from a sample to estimate public opinion during a defined research period.
Learn more: Opinion Poll Services .
Voter Data Analysis and Swing Analysis
Historical electoral data and survey research can be used to study aggregate changes in political preference over time.
This type of research may examine:
- Vote-share movement
- Survey-wave movement
- Turnout changes
- Candidate changes
- Alliance changes
- Constituency-level political trends
The purpose should be to understand aggregate political movement, not to label individual people as persuadable, supportive or opposition voters.
Voter Data Analysis and Election Trend Analysis
Election Trend Analysis examines patterns across multiple elections or research periods.
Data may include:
- Vote share
- Turnout
- Winning margins
- Party performance
- Candidate performance
- Geographic patterns
- Survey-wave trends
Trends describe observed patterns and should not automatically be presented as guaranteed predictions.
Mapping Electoral Data
Maps can make complex election data easier to understand when geographic boundaries are accurate and appropriately matched.
Electoral maps can visualize:
- Constituency boundaries
- Ward boundaries
- Polling-area locations
- Electorate totals
- Historical turnout
- Historical vote share
- Field research coverage
- Public issue locations at aggregate level
Boundary changes and polling-station revisions should be checked before comparing maps from different election years.
Dashboards in Voter Data Analysis
Dashboards help organize large electoral datasets into a format that researchers and management teams can review efficiently.
A dashboard may display:
- Electorate size
- Polling-area totals
- Historical turnout
- Vote-share comparisons
- Margin analysis
- Survey findings
- Data validation status
- Geographic maps
- Historical trends
- Research notes
A dashboard improves presentation, but its reliability still depends on the quality of the underlying data.
Role of Technology in Voter Data Analysis
Modern election-data systems can help manage large datasets more efficiently.
Technology can support:
- Centralized data storage
- Data cleaning workflows
- Duplicate detection
- Geographic mapping
- Survey-data integration
- Historical comparison
- Dashboard reporting
- Access controls
- Audit logs
- Automated quality checks
Technology helps organize and analyze information, but it does not replace source verification or professional analytical judgment.
Role of AI in Election Data Analysis
AI-assisted tools can support selected data-management and analytical tasks when used with proper human oversight.
Potential uses include:
- Data classification
- Duplicate detection assistance
- Anomaly detection
- Historical trend comparison
- Text summarization
- Research-document organization
- Dashboard support
- Data-quality flagging
AI outputs should be reviewed carefully and should not be treated as guaranteed predictors of individual political behaviour or election results.
Data Quality in Voter Data Analysis
High-quality electoral analysis requires more than large quantities of data.
Analysts should consider:
- Source reliability
- Source date
- Dataset version
- Geographic consistency
- Missing records
- Duplicate records
- Historical comparability
- Survey methodology
- Data transformation rules
- Auditability
Incorrect source data can produce sophisticated-looking but unreliable analysis.
Privacy and Data Governance in Voter Data Analysis
Election-related data can include information that requires careful handling.
Responsible data governance can include:
- Use appropriate and lawful data sources
- Collect only information necessary for the defined purpose
- Avoid unnecessary sensitive personal profiling
- Limit access to authorized personnel
- Use secure storage
- Use secure data transfer
- Maintain access logs where appropriate
- Apply retention controls
- Prefer aggregate reporting where possible
- Follow applicable privacy and data requirements
Security of Election Data Systems
Election-related databases and analytical systems should be protected from unauthorized access, accidental disclosure and data loss.
Useful controls may include:
- Strong authentication
- Role-based access
- Encrypted data transfer
- Secure backups
- Access review
- Device security
- Audit logs
- Controlled exports
- Incident-response procedures
Why More Data is Not Always Better
Collecting additional information does not automatically improve election analysis.
Every field should have a defined purpose. Unnecessary information increases storage, privacy and security risks without necessarily improving the quality of the research.
Professional systems should therefore emphasize relevance, accuracy, completeness and appropriate use rather than simply maximizing the amount of personal data collected.
Voter Data Analysis vs Political Survey
Voter Data Analysis
Focuses on structured electoral, geographic, historical and administrative information.
Political Survey
Collects responses from a defined sample to measure public opinion, issues and other research questions.
The two approaches can complement one another but should not be treated as interchangeable.
Voter Data Analysis vs Individual Voter Profiling
Aggregate Election Analysis
Studies constituencies, polling areas, historical results, turnout and other aggregate electoral trends.
Individual Political Profiling
Attempts to assign political preference or behavioural characteristics to individual people. Such profiling creates significant methodological, privacy and governance concerns.
Megamind's analytical approach emphasizes structured election intelligence and aggregate research rather than unnecessary individualized political profiling.
What Should a Voter Data Analysis Report Include?
A professional report should make it possible to understand how the analysis was created.
Reports may include:
- Research objective
- Data sources
- Source dates
- Data-cleaning methodology
- Geographic units
- Historical results
- Turnout analysis
- Vote-share analysis
- Survey integration
- Maps and charts
- Data-quality notes
- Analytical limitations
Benefits of Professional Voter Data Analysis
- Creates organized electoral datasets
- Improves historical comparison
- Provides constituency-level context
- Supports booth-level aggregate analysis
- Improves understanding of turnout trends
- Supports vote-share and trend analysis
- Integrates survey research more effectively
- Improves reporting and visualization
- Provides better data-quality control
- Supports structured election intelligence
Challenges in Voter Data Analysis
Outdated Data
Old electoral datasets may no longer reflect current constituency or polling-area structure.
Duplicate Records
Duplicate or inconsistent records can distort totals and reporting.
Boundary Changes
Geographic and polling-station changes can complicate historical comparison.
Source Quality
Unverified or poorly documented sources can lead to unreliable conclusions.
Privacy Risk
Unnecessary collection or sharing of personal information can create privacy and governance concerns.
Overinterpretation
Aggregate patterns should not be converted into unsupported assumptions about individual people.
Best Practices for Voter Data Analysis
- Define the research objective first
- Verify all major data sources
- Record source dates and versions
- Clean data before analysis
- Verify geographic mapping
- Check historical comparability
- Use aggregate analysis where appropriate
- Avoid unnecessary sensitive personal profiling
- Protect access to electoral datasets
- Maintain audit trails
- Document analytical assumptions
- Explain limitations clearly
How Professional Voter Data Analysis Services Help
Election-data projects can involve thousands or millions of records, multiple source formats, historical datasets, geographic mappings and survey information.
Professional support may include:
- Electoral data collection
- Data cleaning
- Data standardization
- Constituency-wise structuring
- Booth-level aggregate analysis
- Historical result analysis
- Turnout analysis
- Vote-share analysis
- Political survey integration
- GIS and geographic mapping
- Dashboard development
- Analytical reporting
- Data-quality control
- Access and security management
Explore Megamind Voter Data Analysis Services .
Megamind's Voter Data Analysis Approach
Megamind approaches voter data analysis as a structured electoral-data management, verification, geographic analysis and election-intelligence process .
Our framework can follow:
Data Requirement → Source Collection → Source Verification → Data Cleaning → Data Structuring → Geographic Mapping → Historical Analysis → Survey Integration → Trend Analysis → Visualization → Analytical Reporting → Continuous Data Review
Depending on project requirements, voter-data research can be integrated with Political Surveys, Opinion Polls, Vote Share Analysis, Election Trend Analysis, Constituency Analysis, Booth-Level Aggregate Analysis and Election Campaign Management .
Megamind provides election-data and analytical support for political parties, candidates, leaders, prospective candidates, aspirants, campaign teams and political organizations across India.
Explore Voter Data Analysis Services →Voter Data Analysis Across India
Election-data requirements can vary significantly between states, constituencies and election types.
Analysis may be used for:
- Lok Sabha election research
- Vidhan Sabha election research
- Municipal election research
- Local-body election research
- Multi-constituency studies
- State-level election analysis
Data availability, polling-area structure, historical comparability, language and geography may vary across regions, so analytical frameworks should be adapted accordingly.
Megamind can support election-data projects across Uttar Pradesh, Punjab, Delhi, Haryana, Rajasthan, Bihar, Madhya Pradesh, Maharashtra, Gujarat, Uttarakhand and other regions according to project requirements.
Voter Data Analysis Within Election Intelligence
Voter data becomes more useful when combined with other appropriate forms of election research.
Electoral Data → Data Verification → Constituency Mapping → Historical Results → Turnout Analysis → Vote Share Analysis → Political Surveys → Election Trend Analysis → Booth-Level Aggregate Analysis → Analytical Reporting
Each dataset answers different questions. The objective is not to force all information into one conclusion, but to combine relevant evidence carefully and transparently.
FAQs About Voter Data Analysis
1. What is voter data analysis?
Voter data analysis is the structured organization and analysis of electoral, geographic, historical and research data to understand aggregate election patterns.
2. Why is voter data analysis important?
It helps convert scattered election-related datasets into structured information for historical comparison, geographic analysis, quality control and research reporting.
3. What kind of data is used?
Depending on the project, sources may include electoral rolls, historical election results, turnout data, geographic information, political surveys and field research.
4. Can voter data reveal how an individual voted?
No. Election results are reported in aggregate and the voting process is secret. Individual voting choice should not be inferred from aggregate election data.
5. What is booth-level voter data analysis?
It is analysis of aggregate electoral information associated with polling areas, such as historical turnout, vote share, margins and electorate totals.
6. Can booth data identify individual political preference?
No. Booth-level results describe aggregate voting outcomes and do not reveal how a particular individual voted.
7. Why is historical election data important?
It provides context for studying changes in vote share, turnout, margins and other electoral indicators over time.
8. How do political surveys support voter data analysis?
Surveys provide aggregate public-opinion measurements that can be studied alongside historical and administrative election data.
9. What is the role of dashboards?
Dashboards help visualize large datasets through charts, maps, comparisons and research summaries.
10. Can AI be used in voter data analysis?
AI can assist with classification, quality checks, anomaly detection, summarization and aggregate trend analysis, but results require professional human review.
11. Why is data cleaning important?
Duplicate, incomplete, outdated or inconsistent records can distort totals and produce unreliable analysis.
12. What is the difference between voter data analysis and a political survey?
Voter data analysis primarily studies existing electoral and related datasets, while political surveys collect responses from a defined sample to answer research questions.
13. What is the role of privacy in voter data analysis?
Data projects should use appropriate sources, minimize unnecessary information, protect access and avoid unnecessary sensitive personal profiling.
14. Can voter data analysis predict election results?
Historical and current data can provide analytical context, but it cannot guarantee a future election outcome.
15. Who can use professional voter data analysis services?
Political parties, candidates, leaders, prospective candidates, aspirants, political organizations and campaign teams may use professional election-data services according to their research requirements.
Voter Data Analysis Converts Election Data into Structured Intelligence
Voter Data Analysis is an important component of modern election research because it organizes complex electoral information into a form that can be verified, compared and interpreted.
Professional analysis can combine electoral rolls, historical election results, constituency geography, polling-area data, turnout statistics, political surveys and field research to build a broader understanding of the electoral environment.
Its strongest value lies in data quality, historical comparison, aggregate geographic analysis, trend interpretation and responsible reporting rather than individualized political profiling.
When integrated with Political Surveys, Opinion Polls, Vote Share Analysis, Election Trend Analysis and Constituency Research, voter data can form an important part of a comprehensive Election Intelligence System.