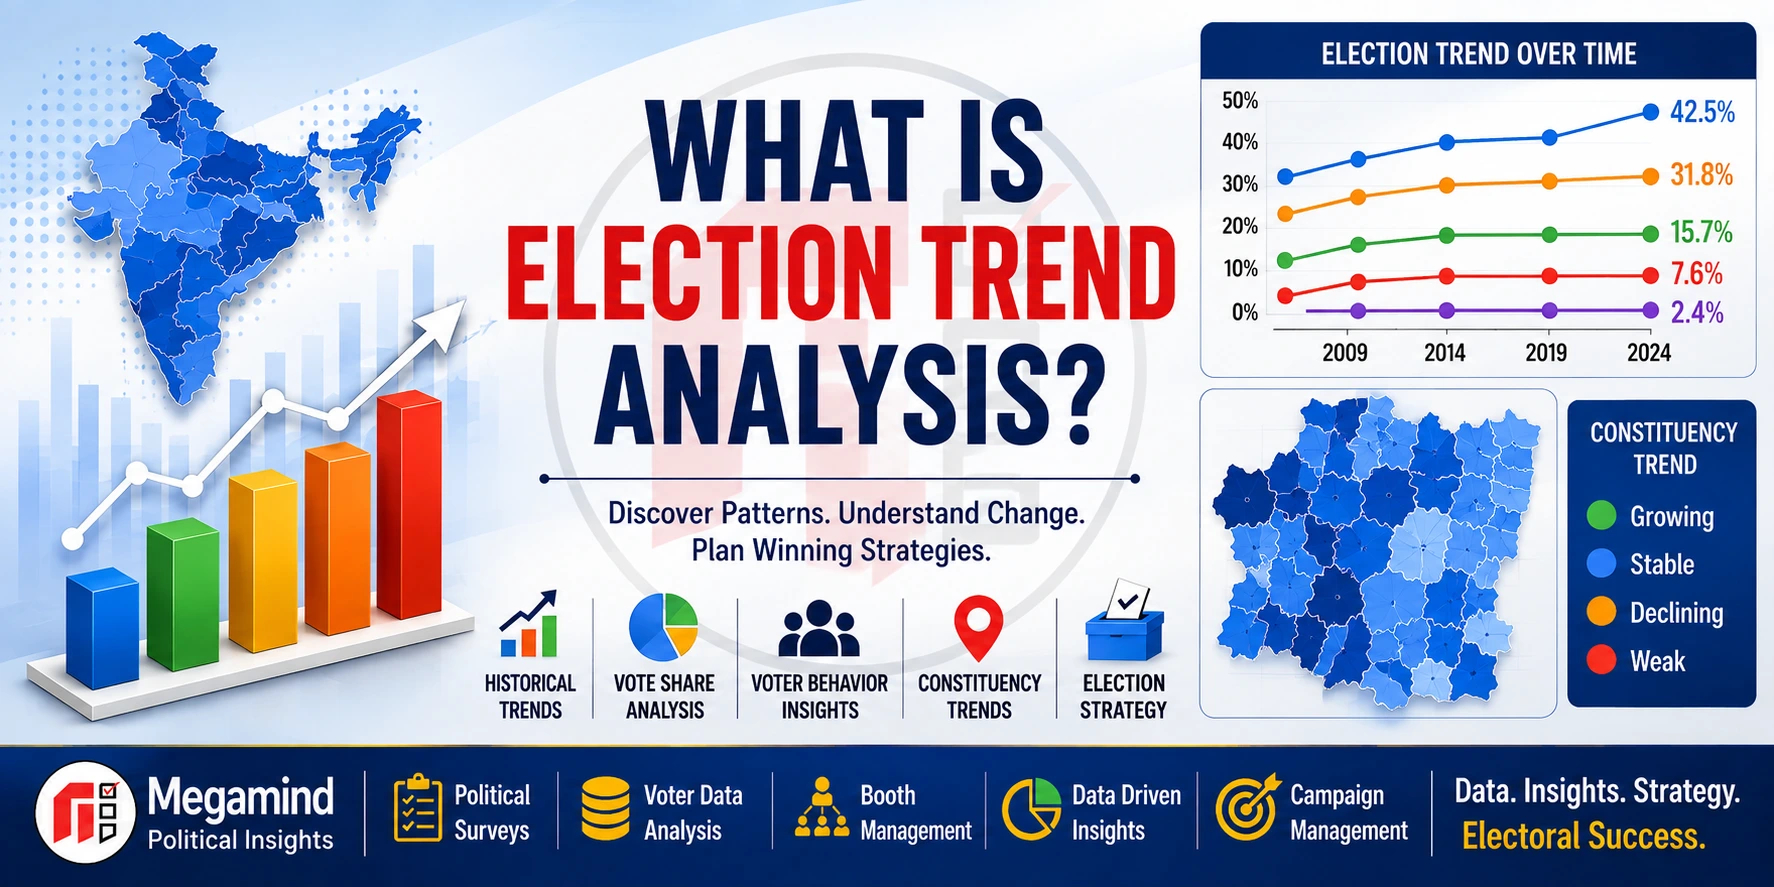
Election Trend Analysis is the systematic study of historical election results, vote share, winning margins, turnout, party and candidate performance, constituency-level changes and geographic electoral patterns across different election cycles. Instead of looking at a single election result in isolation, trend analysis compares electoral information across time and geography to understand what changed, where it changed and how significant that change may be . When combined with political research, surveys, constituency intelligence and verified field information, election trend analysis can provide a stronger evidence base for understanding an evolving electoral environment.
What is an Election Trend?
An election trend is a recurring or measurable pattern observed when electoral information is compared across elections, locations or political contests.
For example, a political party's vote share may increase or decrease across successive elections, turnout may change over time, winning margins may narrow, or political competition may become more fragmented.
These changes become analytically useful when they are measured against comparable historical information rather than interpreted from a single election result.
A trend therefore describes an observed pattern. It does not automatically predict what will happen in the next election.
What is Election Trend Analysis?
Election Trend Analysis is the process of collecting, standardizing, comparing and interpreting electoral information from multiple election cycles and geographic levels.
Depending on the available information, analysis may examine:
- Historical election results
- Party-wise vote share
- Candidate-wise performance
- Winning and losing margins
- Voter turnout patterns
- Constituency-level changes
- Polling-area or booth-level results
- Changes in political competition
Historical findings may then be interpreted alongside current political research, public-opinion surveys and verified constituency information.
Why is Election Trend Analysis Important?
Election results contain more information than simply who won or lost. Comparing results across multiple election cycles can reveal changes that may not be visible from headline results alone.
Election trend analysis helps political organizations and research teams examine the electoral environment using measurable historical indicators.
- Provides historical electoral context
- Measures vote-share movement
- Tracks changes in winning margins
- Examines turnout patterns
- Shows geographic variation
- Highlights changes in competition
- Supports constituency research
- Provides evidence for campaign review
A historical trend should be treated as evidence about the past, not certainty about the future. Candidate changes, alliances, public issues, constituency boundaries, turnout, political conditions and other factors can alter electoral patterns between election cycles.
Key Components of Election Trend Analysis
A comprehensive trend study can combine multiple electoral indicators. Each indicator explains a different aspect of electoral change.
Historical Results
Compare official results from previous elections to establish the historical electoral baseline.
Vote Share
Examine how the percentage of valid votes received by parties or candidates changes across elections.
Winning Margin
Measure changes in the numerical or percentage gap between leading candidates.
Turnout
Compare participation levels across election cycles and geographic areas.
Geographic Patterns
Study how electoral performance varies across constituencies, wards, localities or comparable polling areas.
Political Competition
Examine changes in party competition, candidate performance, alliances and electoral fragmentation.
Step-by-Step Election Trend Analysis Process
A professional election trend study should follow a structured analytical process rather than simply comparing isolated numbers.
Historical Election Trend Analysis
Historical analysis compares electoral performance across previous elections to understand how competition has evolved over time.
Depending on the research question, analysts may compare two elections or examine a longer series covering several election cycles.
- Previous election results
- Vote-share changes
- Winning-margin changes
- Turnout changes
- Party-performance trends
- Candidate-performance trends
- Changes in electoral competition
- Geographic electoral changes
Longer historical series can provide useful context, but comparisons should account for changes in boundaries, alliances, candidates and political conditions.
Vote Share Trend Analysis
Vote share represents the proportion of valid votes received by a political party or candidate within a defined election and geography.
Comparing vote share across elections can show whether electoral performance has increased, decreased or remained relatively stable.
However, vote-share movement should be interpreted alongside other factors such as turnout, number of candidates, alliances and changes in the competitive environment.
For a detailed explanation, explore What is Vote Share Analysis?
Winning Margin Trend Analysis
Winning margin is the difference between the votes received by the winning candidate and the runner-up.
Comparing margins across elections can provide information about changes in the closeness of electoral competition.
A declining margin may indicate that a contest has become closer, while an increasing margin may indicate a larger gap between the leading candidates in that particular election.
Margin changes should not be interpreted independently of turnout, vote share, alliances, candidate changes and the wider political environment.
Voter Turnout Trend Analysis
Voter turnout measures participation in an election relative to the relevant electorate or registered electors, depending on the dataset being used.
Trend analysis can compare turnout across election cycles and geographic areas to identify changes in participation.
- Overall turnout trends
- Constituency-level turnout
- Comparable polling-area turnout
- Urban and rural geographic patterns
- Election-to-election change
- Turnout alongside vote-share movement
Turnout changes can have multiple explanations and should therefore be interpreted carefully rather than attributed automatically to one political cause.
Constituency-Level Election Trend Analysis
State-level or national results can hide substantial variation between individual constituencies.
Constituency-level analysis provides a more localized understanding of electoral history, competition, turnout, party performance and candidate performance.
Analysis may consider:
- Historical constituency results
- Party-wise vote share
- Candidate performance
- Winning margins
- Turnout trends
- Changes in competition
- Geographic differences
- Relevant local political developments
These findings can be interpreted alongside Constituency Profiling and current political research.
Booth-Level Election Trend Analysis
Where reliable and comparable polling-station or booth-level results are available, they can provide a more granular geographic view of historical electoral patterns.
Analysts may compare vote share, turnout and other aggregate results across polling areas to understand geographic variation within a constituency.
Booth-level comparisons require particular care because polling-station boundaries, numbering, voter allocation and administrative arrangements may change between elections.
Therefore, historical booth records should be matched and verified before drawing conclusions from election-to-election comparisons.
Aggregate booth-level intelligence can complement campaign-side Booth Management and field reporting.
Party-Wise Election Trend Analysis
Party-wise analysis examines how political parties have performed across election cycles, constituencies or broader geographic areas.
- Party-wise vote share
- Seat-performance history
- Vote-share growth or decline
- Geographic performance differences
- Changes in competitive position
- Effects of alliance changes
Alliance structures are particularly important because party-wise comparisons can become misleading when coalition arrangements change between elections.
Candidate Performance Trend Analysis
Candidate performance analysis examines publicly available electoral outcomes associated with candidates across comparable contests.
Depending on the available history, this can include vote share, winning or losing margins, constituency performance and election-to- election changes.
Candidate-level trends should be interpreted carefully because party affiliation, alliances, constituency boundaries, opponents and local political circumstances may change between elections.
Why Constituency Boundary Changes Matter
One of the most important challenges in historical election analysis is geographic comparability.
Constituency or polling-area boundaries may change between election cycles. When geographic units change, a simple comparison of two historical results may not represent an equivalent electorate or area.
Before comparing historical elections, analysts should therefore determine whether:
- Constituency boundaries remained comparable
- Polling areas were reorganized
- Booth numbering changed
- Administrative areas were restructured
- Electoral units can be reliably matched
- Historical data requires normalization
Role of Political Surveys in Election Trend Analysis
Historical election data explains what happened in previous electoral contests. A political survey, by contrast, can provide a current snapshot of public opinion when conducted using an appropriate research methodology.
Combining the two can help analysts examine whether historical patterns appear consistent with, or different from, current research findings.
Survey research may examine questions such as:
- Current public opinion
- Issue priorities
- Candidate awareness
- Political satisfaction
- Public assessment of local issues
- Changes observed across survey waves
Professional Political Survey Services can complement historical electoral analysis with current field research.
Role of Voter Data Analysis in Election Trend Analysis
Voter Data Analysis can provide additional aggregate geographic and electoral context for historical trends.
Depending on lawful data availability and the research objective, analysis may examine aggregate electorate size, turnout, polling-area information and historical electoral performance.
- Aggregate electoral-roll statistics
- Geographic electoral patterns
- Polling-area comparisons
- Historical turnout
- Historical vote-share trends
- Constituency-level changes
Learn more about Voter Data Analysis and its role in election intelligence.
Election Trend Analysis and Campaign Strategy
Election trend analysis can provide historical context for campaign research and strategic planning.
Instead of treating historical patterns as instructions for future action, professional analysis uses them to identify questions that require further investigation.
For example, a significant change in turnout, vote share or competitive margin may indicate that additional constituency research is needed to understand the factors behind that change.
- Understand historical competition
- Identify areas requiring further research
- Compare constituency-level changes
- Review previous campaign performance
- Support resource planning
- Inform field-research requirements
- Improve campaign reporting
- Support continuous strategic review
Trend analysis can therefore form one analytical input within a broader Election Strategy and Planning framework.
Data Quality in Election Trend Analysis
The quality of a trend analysis depends heavily on the quality and comparability of the underlying information.
Before analysis, electoral datasets should be reviewed for missing records, inconsistent naming, geographic changes, duplicate entries, incorrect mappings and differences in data definitions.
- Verify data sources
- Check election year and election type
- Standardize party and candidate names
- Review constituency changes
- Verify polling-area mappings
- Check missing or incomplete records
- Document analytical assumptions
- Maintain reproducible calculations
Reliable analysis should make important limitations visible rather than hiding uncertainty in the data.
Role of Digital Technology in Election Trend Analysis
Digital analytics systems can make large volumes of historical electoral information easier to organize, compare and interpret.
Election data may be presented through charts, maps, trend lines, tables and comparative dashboards.
- Historical election dashboards
- Vote-share trend graphs
- Margin comparison charts
- Turnout visualization
- Geographic election maps
- Constituency comparison dashboards
- Polling-area visualization
- Structured analytical reports
Visualization does not replace analysis, but it can make complex electoral information easier for decision-makers to review.
Election Trend Analysis and AI-Assisted Analytics
AI-assisted analytical tools can help organize large datasets, identify recurring patterns, summarize information and detect unusual changes that may require further examination.
Machine-learning or statistical models may also be used as analytical support where appropriate.
However, model output depends on the quality of the underlying data, assumptions and methodology.
AI output is analytical assistance—not guaranteed election prediction. Important findings should be interpreted alongside verified data, research methodology, political context and current field information.
Data Governance and Responsible Election Analysis
Election analytics may combine information from multiple public, research and internal sources. Clear data-governance practices help maintain reliability and appropriate access.
- Use appropriately sourced information
- Collect only data necessary for the analysis
- Prefer aggregate analysis where appropriate
- Avoid unnecessary sensitive personal profiling
- Maintain access controls
- Secure analytical databases
- Document important data sources
- Apply quality-control procedures
Benefits of Election Trend Analysis
When conducted carefully, trend analysis can provide a structured historical perspective for election research.
- Creates historical electoral context
- Measures vote-share changes
- Tracks turnout patterns
- Examines margin changes
- Shows geographic variation
- Supports constituency intelligence
- Improves historical campaign review
- Supports evidence-based planning
- Identifies questions for further research
- Improves analytical reporting
Challenges and Limitations of Election Trend Analysis
Historical patterns can be valuable, but elections are dynamic political events. Past performance alone cannot establish what will happen in a future election.
- Constituency-boundary changes
- Polling-area reorganization
- Changes in political alliances
- Candidate changes
- Changes in turnout
- New political issues
- Multi-party competition
- Incomplete historical datasets
- Different election types
- Changing political conditions
Historical trends should therefore be interpreted as one source of evidence within a wider election-research framework.
Best Practices for Election Trend Analysis
- Use reliable electoral sources
- Compare appropriate election cycles
- Check geographic comparability
- Analyze vote share with turnout
- Review margins and competition together
- Account for alliance changes
- Document data limitations
- Use aggregate geographic analysis appropriately
- Combine history with current research
- Present findings through clear visualization
Election Trend Analysis vs Vote Share Analysis
Vote Share Analysis
Primarily examines the percentage of valid votes received by political parties or candidates and changes in that percentage.
Election Trend Analysis
Uses a broader framework that can include vote share, turnout, margins, party performance, candidate performance, geographic variation and changes in competition.
Vote Share Analysis can therefore be considered one important component within a broader Election Trend Analysis framework.
Election Trend Analysis vs Opinion Poll
Election Trend Analysis
Primarily examines historical and comparable electoral data to understand patterns across elections and geography.
Opinion Poll
Uses survey research to measure public opinion or stated preferences at a particular period before an election.
The two can complement each other because historical electoral information provides context while current survey research provides a more recent measurement of public opinion.
Election Trend Analysis is Not Election Prediction
Trend analysis and election prediction should not be treated as the same concept.
Trend analysis identifies and explains patterns present in available historical or current data. Prediction attempts to estimate a future outcome using assumptions, models or other methods.
A strong historical trend can still change because elections are affected by new political developments, candidates, alliances, public issues, turnout and other factors.
Historical pattern ≠ guaranteed future outcome. Election trend analysis should support understanding and research, not be presented as certainty about a future election result.
How Professional Election Trend Analysis Services Help
Professional election-research teams can organize large volumes of historical results and related electoral information into structured analytical datasets.
This can include data cleaning, historical comparison, constituency mapping, vote-share analysis, turnout analysis, margin analysis, visualization, survey integration and analytical reporting.
Trend analysis can also be integrated with Election Campaign Management , Political Survey, Voter Data Analysis, Booth Management and constituency intelligence.
Megamind's Approach to Election Trend Analysis
Megamind approaches election trend analysis as a structured election intelligence process rather than a simple comparison of past results.
Depending on project requirements, the analytical workflow can include:
Electoral Data Collection → Data Verification → Historical Comparison → Vote Share & Turnout Analysis → Geographic Trend Analysis → Political Research Integration → Visualization → Strategic Reporting
The objective is to convert historical electoral information into clear, organized and interpretable intelligence that can support political research, constituency understanding and campaign planning.
Megamind's broader election intelligence capabilities can integrate Political Survey, Opinion Poll, Voter Data Analysis, Constituency Intelligence, Booth Management, Election Campaign Management and campaign technology according to project requirements.
Explore Complete Election Services →Election Trend Analysis Across India
Election Trend Analysis can be used to study Lok Sabha, Vidhan Sabha, municipal and other electoral contexts where appropriate historical information is available.
The analytical framework may differ according to election type, geography, data availability and the specific research question.
Large-scale analysis may examine patterns across multiple constituencies, while constituency studies can provide a more detailed view of local electoral history.
Professional analysis should therefore begin by defining the exact geographic and electoral units being compared.
Election Trend Analysis Within a Complete Election Intelligence System
Historical trends become more informative when they are interpreted alongside other forms of election research.
Historical Election Data → Trend Analysis → Constituency Intelligence → Political Survey → Current Field Research → Strategic Interpretation → Monitoring & Review
Historical data explains previous electoral outcomes, surveys can measure current public opinion, field research provides contemporary local context and analytical reporting brings these information streams together.
FAQs About Election Trend Analysis
What is Election Trend Analysis?
Election Trend Analysis is the systematic comparison of electoral information across elections or geographic areas to identify measurable historical patterns and changes.
What data is used in Election Trend Analysis?
Depending on availability, analysis may use historical election results, vote share, turnout, winning margins, party performance, candidate performance and aggregate geographic results.
What is a vote-share trend?
A vote-share trend shows how the percentage of valid votes received by a party or candidate changes across comparable elections.
Why are winning margins analyzed?
Margin analysis helps show whether the gap between leading candidates has increased, decreased or remained relatively stable across comparable contests.
Why is turnout important in trend analysis?
Turnout provides context for electoral participation and should often be reviewed alongside vote-share and result changes.
Can booth-level results be compared across elections?
They can be compared when reliable data is available, but analysts should first check whether polling areas, booth numbers or voter allocations changed between elections.
How do political surveys complement trend analysis?
Historical data describes previous elections, while surveys can provide a current measurement of public opinion using a defined research methodology.
Is Election Trend Analysis the same as Vote Share Analysis?
No. Vote Share Analysis focuses primarily on vote percentages, while Election Trend Analysis can include vote share, turnout, margins, geography and other electoral indicators.
Is Election Trend Analysis the same as an Opinion Poll?
No. Trend analysis primarily studies electoral patterns across time, while an Opinion Poll measures public opinion through survey research at a particular period.
Can Election Trend Analysis predict an election result?
Historical trends can provide context but should not be treated as guaranteed predictions of future election outcomes.
How can technology help Election Trend Analysis?
Technology can support data cleaning, calculations, geographic mapping, visualization, dashboards and structured analytical reporting.
Can AI be used in election trend analysis?
AI-assisted tools can help organize data and identify patterns, but their outputs require validation and should not be treated as guaranteed election predictions.
Who can use Election Trend Analysis services?
Political parties, candidates, leaders, prospective candidates, aspirants, campaign teams and political organizations may use election trend analysis according to their research and campaign-management requirements.
Election Trend Analysis Turns Historical Results into Electoral Intelligence
Election Trend Analysis provides a structured method for understanding how electoral performance and political competition have changed across time and geography.
By examining historical results, vote share, winning margins, turnout, party performance, candidate performance and geographic patterns , analysts can build a clearer picture of the electoral environment.
The strongest analysis also considers data quality, geographic comparability, alliance changes and current political conditions.
When combined with political surveys, constituency intelligence, aggregate electoral data analysis and verified field research, historical trends can become an important component of a broader election intelligence framework.
The purpose is not to guarantee future election results, but to provide reliable historical context, clearer analytical understanding and better-informed research and planning .