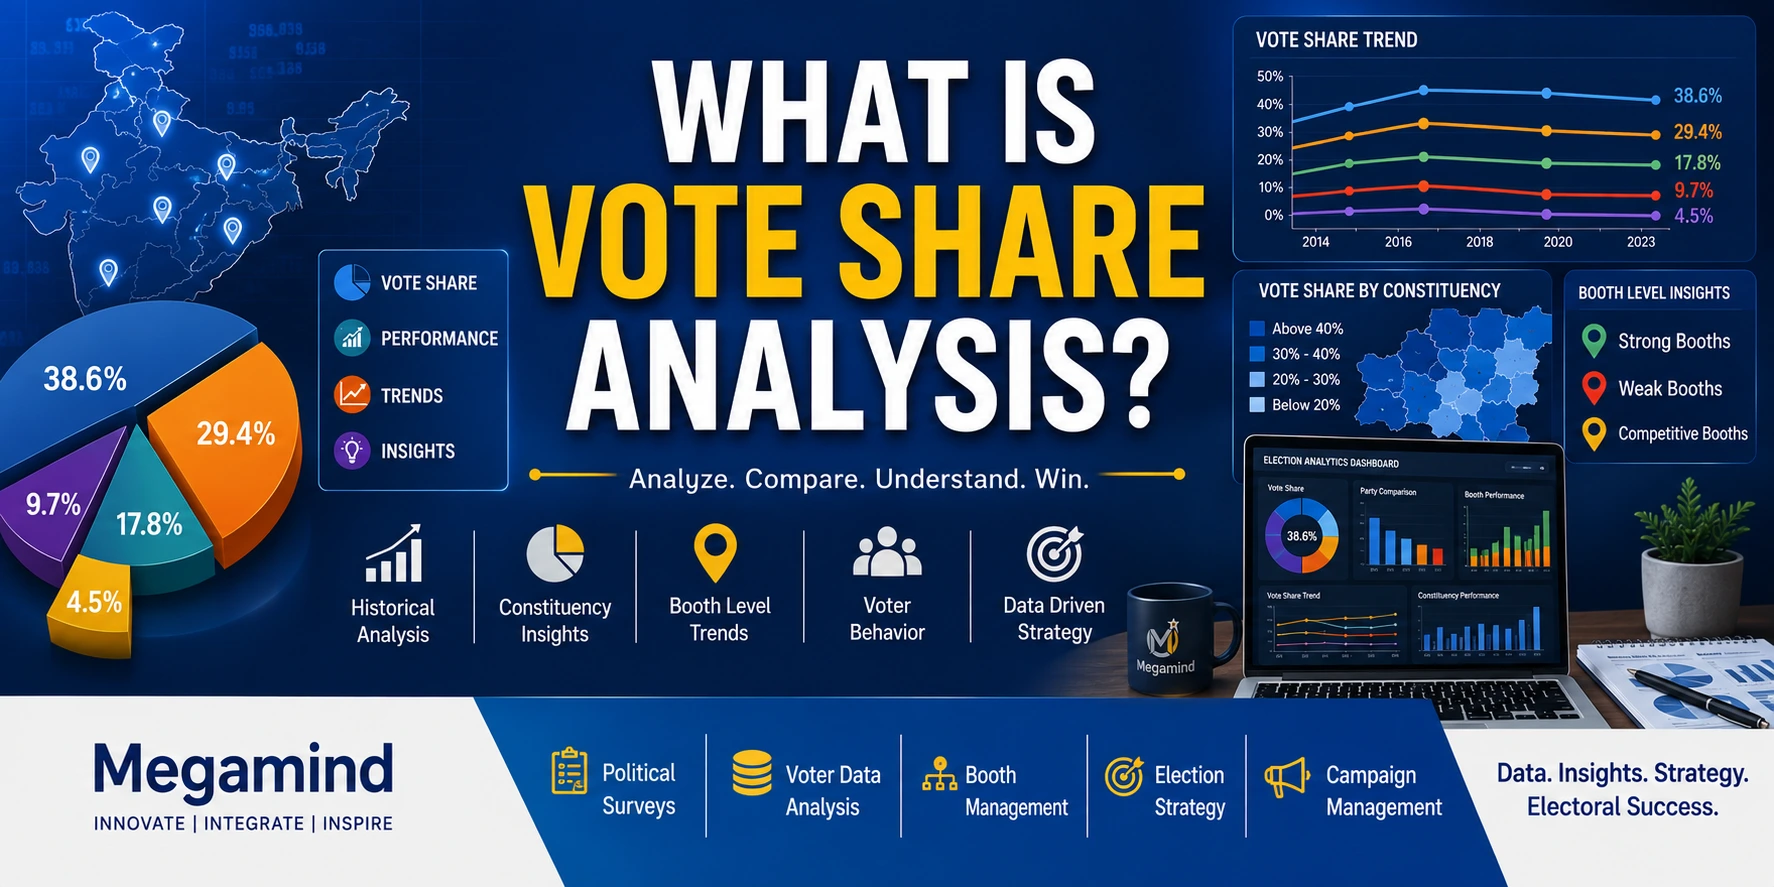
Vote Share Analysis is the systematic study of the percentage of valid votes received by political parties or candidates in an election. Instead of looking only at who won or lost, vote share analysis examines how votes were distributed, how that distribution changed across election cycles, and how electoral performance varied across constituencies and polling areas . When combined with turnout, winning margins, historical results, political surveys and verified electoral data, vote share analysis provides a more complete understanding of the electoral landscape.
What is Vote Share?
Vote share refers to the percentage of valid votes received by a political party or candidate out of the total valid votes cast in the relevant electoral contest.
Vote share is different from the absolute number of votes. If turnout or electorate size changes between elections, a party may receive more votes while its percentage share changes differently.
What is Vote Share Analysis?
Vote Share Analysis is the structured comparison and interpretation of voting percentages across elections, candidates, political parties and geographic units.
Analysis can be conducted at different levels:
- National level
- State level
- Parliamentary constituency
- Assembly constituency
- Assembly segment
- Municipal ward
- Local body area
- Polling-station / booth aggregate level
The purpose is to understand observed electoral patterns rather than assume that historical vote share will automatically continue in a future election.
Vote share is a measurement, not a prediction. A 40% vote share in one election does not mean that a party or candidate will receive 40% in the next election. Candidate changes, alliances, turnout, local issues, political conditions and the number of contestants can all change the final distribution of votes.
Why is Vote Share Analysis Important?
Election results alone can hide important changes in electoral performance.
For example, a candidate may lose an election while receiving a substantially larger percentage of votes than in a previous contest. Conversely, a winning candidate may retain the seat while receiving a smaller vote share than before.
- Measures electoral performance
- Compares multiple election cycles
- Identifies changes in vote distribution
- Provides historical context
- Supports constituency research
- Supports aggregate booth-level analysis
- Helps interpret turnout changes
- Measures political competition
- Supports trend analysis
- Provides a baseline for further research
Key Components of Vote Share Analysis
Vote Percentage
Measures the proportion of valid votes received by each candidate or party.
Historical Results
Compares vote share across relevant previous election cycles.
Vote-Share Change
Measures percentage-point increase or decrease between elections.
Turnout
Reviews participation levels alongside vote distribution.
Winning Margin
Measures the difference between the leading candidates.
Geographic Analysis
Compares electoral results across constituencies and polling areas.
Political Competition
Reviews how votes are distributed among multiple contestants.
Survey Research
Adds current aggregate political research to historical election data.
Data Quality
Checks boundaries, election type, polling-area changes and comparability before interpretation.
How Vote Share Analysis Works
Historical Vote Share Analysis
Historical analysis compares the distribution of votes across previous elections to identify longer-term electoral patterns.
Analysts may compare:
- Candidate vote totals
- Party vote totals
- Vote-share percentages
- Percentage-point change
- Winning and runner-up margins
- Turnout levels
- Number of contestants
- Alliance changes
- NOTA where relevant
- Election-to-election geographic changes
Historical comparison becomes more meaningful when analysts verify that the elections and geographic units being compared are actually comparable.
How is Vote Share Change Calculated?
Vote-share change is generally expressed in percentage points.
A percentage-point change should not be confused with percentage growth. The two calculations answer different questions.
Constituency-Level Vote Share Analysis
Constituency-level analysis studies the distribution and movement of votes within a specific electoral constituency and compares it with relevant historical contests.
Research may examine:
- Total valid votes
- Candidate-wise vote share
- Party-wise vote share
- Historical percentage-point change
- Winning margins
- Turnout trends
- Candidate changes
- Alliance changes
- Number of contestants
- Geographic electoral patterns
This can be combined with Constituency Profiling for a broader understanding of geography, local issues, infrastructure, historical elections and field research.
Booth-Level Vote Share Analysis
Booth-level analysis studies officially reported aggregate election results at polling-station or polling-area level where such data is available and comparable.
It may examine:
- Total votes recorded
- Candidate-wise aggregate vote totals
- Vote-share percentages
- Historical turnout
- Winning margins
- Election-to-election movement
- Geographic result patterns
- Polling-area changes
Booth-level results are aggregate geographic data. They do not reveal how an individual elector voted.
Polling-station numbers, boundaries or voter allocation can change between elections. Those changes should be verified before making historical comparisons.
Related service: Booth Management
Vote Share and Voter Turnout
Vote share and turnout describe different dimensions of an election.
Turnout measures participation among eligible electors, while vote share measures how valid votes were distributed among candidates.
Vote Share
Percentage of valid votes received by a candidate or party.
Turnout
Percentage or number of electors who participated in the election, depending on the measure used.
Changes in turnout can alter absolute vote totals and the overall vote distribution. However, a turnout increase or decrease should not automatically be attributed to any particular party without additional evidence.
Vote Share vs Winning Margin
Vote share and winning margin are related but distinct electoral measurements.
Vote Share
Shows the percentage of valid votes received by a candidate or political party.
Winning Margin
Shows the vote difference between the winning candidate and the runner-up.
Analysts often review both measures because the same vote-share percentage can produce different margins depending on how votes are distributed among other contestants.
Vote Share Analysis in Multi-Party Elections
Vote share becomes particularly important in multi-party contests because winning a seat does not necessarily require more than half of all valid votes.
Analysts may study:
- Leading candidate vote share
- Runner-up vote share
- Third and subsequent candidate shares
- Independent candidate performance
- NOTA where relevant
- Overall vote fragmentation
- Changes in the competitive field
- Alliance-related changes
This helps explain why a candidate can win with a relatively modest share of total valid votes in a fragmented contest.
Party Vote Share vs Candidate Vote Share
Candidate vote share and party vote share should not always be interpreted as identical concepts.
Candidate-specific factors can affect an individual constituency, while broader party performance may be studied across many constituencies.
Analysts should therefore clearly define whether the research is measuring:
- Candidate-level performance
- Party performance within one constituency
- Party performance across multiple constituencies
- Alliance-level vote share where methodologically appropriate
Vote Share Analysis and Swing Analysis
Vote-share movement across elections can form part of broader Swing Voter Analysis .
In professional election research, this should focus on aggregate movement in political preferences and electoral results rather than attempting to identify or label individual electors as persuadable or undecided.
Historical results show what happened in previous elections, while appropriately designed surveys can provide current aggregate research that may help explain changing political conditions.
Vote Share Analysis vs Election Trend Analysis
Vote Share Analysis
Focuses primarily on the percentage and distribution of valid votes received by candidates or parties.
Election Trend Analysis
Uses a broader set of indicators such as vote share, margins, turnout, political competition, candidates and historical electoral patterns.
Learn more: What is Election Trend Analysis?
Role of Political Surveys in Vote Share Analysis
Historical election results describe previous electoral outcomes. Political surveys, when properly designed and interpreted, can provide a current research layer.
Survey research may examine aggregate findings related to:
- Current political preferences
- Candidate assessments
- Public issues
- Government-performance assessments
- Political preference stability
- Changes between survey waves
Survey findings should be interpreted according to sample design, sample size, field dates, questionnaire design, weighting and uncertainty.
Explore: Political Survey Services
Vote Share Analysis and Opinion Polls
An opinion poll may estimate current political preferences using a sample of respondents, while historical vote-share analysis is based on recorded election results.
Historical Vote Share
Based on votes recorded in a completed election.
Opinion Poll Estimate
Based on a sample survey conducted before voting and subject to sampling and other forms of uncertainty.
Explore: Opinion Poll
Vote Share Analysis and Exit Polls
Exit polls use survey samples to estimate voting patterns after respondents have voted. Official election results, once declared, provide the actual recorded vote totals used for final vote-share calculation.
Exit-poll estimates and official vote share should therefore not be treated as the same type of measurement.
Explore: Exit Poll
Role of Voter Data Analysis
Appropriate electoral data can add geographic and historical context to vote-share research.
Useful aggregate information can include:
- Electorate totals
- Polling-area geography
- Historical turnout
- Historical election results
- Constituency-level vote share
- Booth-level aggregate vote share
- Electorate-size changes
- Boundary or polling-area changes
Electoral analysis should not infer an individual's political preference from age, gender, community, occupation or other personal characteristics.
Explore: Voter Data Analysis
Constituency and Polling-Area Boundary Changes
Historical election comparison becomes difficult when constituency boundaries, polling-station structures or geographic assignments change.
Before comparing election cycles, analysts should check:
- Constituency boundary changes
- Ward restructuring
- Polling-station renumbering
- Polling-area reassignment
- New or merged polling stations
- Election type and geographic unit
A numerical comparison can be mathematically correct but analytically misleading if the underlying geographic units have changed.
How Political Alliances Affect Vote Share Analysis
Alliance structures can significantly affect election-to-election comparison.
If parties contest separately in one election and together in another, simply comparing individual party vote shares may not provide a complete picture.
Analysts should document:
- Alliance composition
- Seat-sharing arrangements relevant to the data
- Party symbols and candidate affiliation
- Independent or rebel candidates where relevant
- Changes between election cycles
Can Vote Transfer Be Measured from Election Results Alone?
Not reliably at the individual level.
Aggregate election results can show that vote shares changed between elections, but they do not reveal exactly which individual voters changed from one party or candidate to another.
Claims about vote transfer therefore require careful methodology and should not be inferred automatically from aggregate booth or constituency results.
Data Quality in Vote Share Analysis
The quality of the final analysis depends directly on the quality and comparability of the underlying election data.
- Verify data source
- Check valid-vote totals
- Verify candidate names and party affiliation
- Check election year and election type
- Verify constituency boundaries
- Review polling-area changes
- Document missing data
- Use consistent calculations
- Separate official results from survey estimates
- Maintain reproducible analysis
How Technology Improves Vote Share Analysis
Modern data systems can make large historical election datasets easier to organize, compare and visualize.
- Election databases
- Interactive dashboards
- Constituency maps
- Polling-area maps
- Historical trend charts
- Vote-share comparison tables
- Turnout visualization
- Automated calculations
- Data-quality checks
- Analytical reporting
Visualization helps researchers see patterns more clearly, but the underlying data and methodology remain more important than the appearance of a dashboard.
Role of AI in Vote Share Analysis
AI-assisted systems can help researchers process large election datasets, but they should not be treated as guaranteed election prediction systems.
Appropriate analytical applications can include:
- Historical data organization
- Automated data-quality checks
- Trend summarization
- Anomaly detection
- Chart and dashboard assistance
- Election-to-election comparison
- Research-report summarization
Statistical and AI-generated findings should remain subject to human review, data-quality checks and methodological interpretation.
Privacy and Data Governance
Vote-share research primarily works with aggregate election results. When it is combined with surveys or other datasets, responsible data governance becomes particularly important.
- Use appropriate and lawful data sources
- Collect only information required for the research
- Prefer aggregate reporting where appropriate
- Protect survey confidentiality
- Restrict access to research data
- Avoid unnecessary sensitive personal profiling
- Maintain data-security controls
- Document analytical methods
Is Vote Share Analysis an Election Prediction?
No. Historical vote-share analysis describes previous electoral performance.
It can provide an important baseline for understanding the political landscape, but future results may change because of:
- New candidates
- Political alliances
- Changes in turnout
- Local and national issues
- Government-performance assessments
- Campaign developments
- Changes in the competitive field
- Political events between elections
Historical patterns should therefore be treated as evidence about the past, not certainty about the future.
Benefits of Vote Share Analysis
- Provides a clear electoral performance measure
- Supports historical comparison
- Shows percentage-point movement
- Provides geographic electoral context
- Supports constituency research
- Supports aggregate booth-level research
- Helps interpret turnout and margins
- Provides context for political surveys
- Supports election trend analysis
- Improves analytical reporting
- Helps identify data requiring further research
- Provides a structured electoral baseline
Challenges in Vote Share Analysis
Boundary Changes
Constituency or polling-area changes can reduce direct comparability.
Alliance Changes
Different party alliances can complicate historical comparisons.
Candidate Changes
Candidate-specific factors may affect constituency results.
Turnout Changes
Different participation levels can alter vote totals and distribution.
Data Quality
Missing, inconsistent or incorrectly mapped data can distort analysis.
Over-Interpretation
Aggregate results cannot reliably explain every individual voting decision.
Best Practices for Vote Share Analysis
- Use reliable election-result data
- Verify valid-vote totals
- Compare relevant election cycles
- Check geographic comparability
- Analyze vote share with turnout
- Review winning margins
- Document alliance changes
- Review candidate changes
- Separate aggregate results from individual behavior
- Use surveys as a separate current research layer
- Document assumptions and limitations
- Update analysis when reliable new data becomes available
Professional Vote Share Analysis Services
Professional election research teams can transform large volumes of historical election results into structured and understandable electoral intelligence.
Professional analysis may include:
- Historical election database preparation
- Vote-share calculation
- Percentage-point comparison
- Constituency analysis
- Aggregate booth-level analysis
- Turnout analysis
- Winning-margin analysis
- Political competition analysis
- Election trend analysis
- Survey integration
- Geographic visualization
- Dashboards and analytical reports
Vote-share research can also form part of a broader Election Campaign Management and election intelligence framework.
Megamind's Vote Share Analysis Approach
Megamind approaches Vote Share Analysis as a structured electoral research process combining historical election data, verification, geographic analysis, statistical comparison and current political research .
Our analytical framework can follow:
Research Objective → Electoral Data Collection → Data Verification → Vote Share Calculation → Historical Comparison → Turnout & Margin Analysis → Constituency Analysis → Booth-Level Aggregate Analysis → Political Survey Integration → Trend Interpretation → Visualization → Analytical Reporting
The objective is to transform election-result data into clear, documented and methodologically responsible electoral intelligence.
Explore Voter Data Analysis →Vote Share Analysis Across India
Vote-share analysis can be applied to different election types and geographic levels across India, subject to the availability and comparability of relevant election data.
- Lok Sabha elections
- Vidhan Sabha elections
- Municipal elections
- Local body elections
- Constituency-level research
- Aggregate polling-area research
The methodology should be adapted to the election type, geographic unit, available historical data and research objective.
Vote Share Analysis Within an Integrated Research Framework
Vote share becomes more informative when it is interpreted alongside other reliable election research.
Historical Results → Vote Share Analysis → Winning Margin → Turnout Analysis → Election Trend Analysis → Constituency Analysis → Booth-Level Aggregate Analysis → Political Survey → Opinion Poll → Field Research → Analytical Reporting
FAQs About Vote Share Analysis
1. What is vote share?
Vote share is the percentage of valid votes received by a candidate or political party in an election.
2. How is vote share calculated?
Divide the votes received by the total valid votes cast and multiply the result by 100.
3. What is Vote Share Analysis?
It is the systematic comparison and interpretation of vote percentages across candidates, parties, elections and geographic areas.
4. Why is vote share more informative than win or loss alone?
Because it shows the proportion of valid votes received and allows performance to be compared across relevant elections.
5. What is vote-share change?
It is the difference between vote-share percentages across two elections, normally expressed in percentage points.
6. Is vote share the same as winning margin?
No. Vote share is a percentage of valid votes, while winning margin is the difference in votes between the winner and runner-up.
7. Can vote share be analyzed at booth level?
Yes, where reliable aggregate polling-station result data is available and geographic units are comparable.
8. Does booth-level vote share reveal how individuals voted?
No. Booth results are aggregate totals and do not reveal an individual's vote.
9. How does turnout affect vote share?
Changes in participation can affect absolute vote totals and vote distribution, so turnout should be reviewed alongside vote share.
10. Can historical vote share predict the next election?
No. It provides a historical baseline, but political conditions, candidates, alliances, turnout and other factors can change.
11. How are political surveys related to vote share analysis?
Historical vote share describes completed elections, while surveys can provide a separate current research layer about aggregate political opinion.
12. What is the difference between vote share and an opinion poll estimate?
Official vote share is calculated from completed election results. An opinion-poll estimate is based on a sample survey and is subject to uncertainty.
13. Can vote transfer be identified from booth results?
Aggregate results can show changes in vote distribution, but they do not reveal exactly which individual electors changed their political preference.
14. Why are boundary changes important?
Constituency or polling-area changes can make historical results less directly comparable.
15. What data is needed for professional vote share analysis?
Relevant election results, valid-vote totals, candidate and party information, turnout, geographic definitions and historical comparison data are commonly required.
Vote Share Analysis Provides Deeper Electoral Context
Vote Share Analysis goes beyond the simple question of who won or lost an election.
By examining vote percentages, historical changes, winning margins, turnout, political competition, constituency patterns and aggregate booth-level results , researchers can build a more detailed understanding of electoral performance.
Its value becomes stronger when the analysis uses verified data, comparable geographic units, transparent calculations and appropriate statistical interpretation.
When combined with political surveys, election trend analysis, constituency research and Voter Data Analysis , vote share analysis becomes an important component of a broader election intelligence framework.