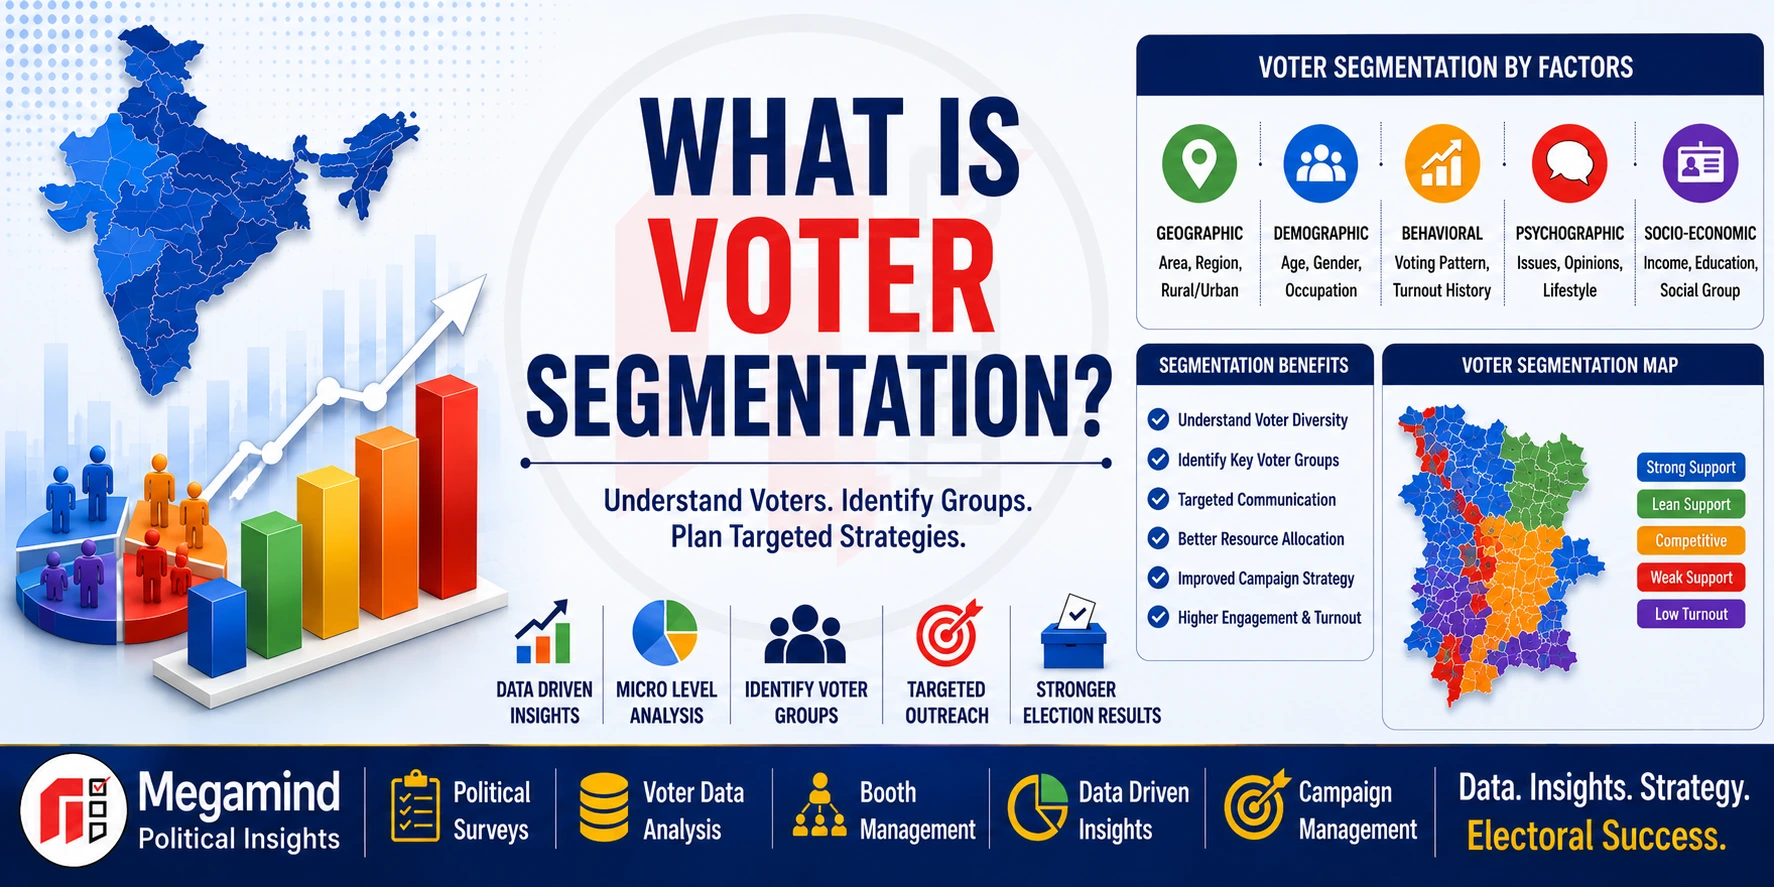
Voter Segmentation is an analytical technique used in election research to organize a large and complex electorate into meaningful analytical groups. In responsible election analysis, segmentation is most useful when it focuses on geography, electoral areas, historical turnout, vote-share patterns, survey-level findings, constituency characteristics and other aggregate research indicators . The purpose is not to label individual citizens or assume how a specific person will vote. Instead, segmentation helps researchers organize complex datasets so that broad electoral patterns become easier to compare, visualize and understand.
What Does Voter Segmentation Mean?
Voter Segmentation means dividing electoral or survey information into analytical groups according to a clearly defined research objective.
These groups might be based on:
- Constituency geography
- Ward or locality
- Polling-area geography
- Urban and rural areas
- Historical turnout patterns
- Historical vote-share patterns
- Election-result trends
- Aggregate political survey findings
- Public issue patterns
- Research periods
Segments should be created only when they add meaningful analytical value and the underlying data supports the comparison.
Voter Segmentation is Not Individual Political Profiling
Election research sometimes uses the word segmentation broadly, but there is an important difference between aggregate analytical segmentation and individualized political profiling.
Aggregate Segmentation
Organizes geographic areas, survey results, historical election information or other aggregated data into research categories.
Individual Political Profiling
Attempts to assign political preferences or political characteristics to specific individuals using personal data or inferred attributes.
Professional election research should avoid unnecessary sensitive personal profiling and should use aggregate data wherever that level of analysis is sufficient.
The objective of segmentation is not to create the greatest possible number of categories. Good segmentation creates fewer, meaningful, verifiable and interpretable analytical groups that help explain differences within the electoral landscape.
Why Voter Segmentation is Important in Election Research
Constituency-wide averages can hide important geographic and historical differences.
For example, different areas of the same constituency may have:
- Different electorate sizes
- Different historical turnout
- Different vote-share histories
- Different infrastructure conditions
- Different public issues
- Different survey findings
- Different patterns of electoral change
Segmentation helps researchers move from one constituency-wide average toward a more structured understanding of these aggregate differences.
Main Objectives of Voter Segmentation
Organize Data
Convert large electoral datasets into structured analytical categories.
Compare Geography
Examine aggregate differences between electoral areas.
Study Turnout
Compare historical turnout patterns across geographic units and election cycles.
Study Trends
Compare historical electoral movement and changes over time.
Integrate Surveys
Compare aggregate political-survey findings across appropriate research categories.
Improve Reporting
Make complex election information easier to visualize and explain.
Key Types of Voter Segmentation
The most appropriate segmentation method depends on the research question and the quality of the available data.
Geographic Segmentation
Organizes election data according to constituency, ward, village, locality or polling-area geography.
Turnout Segmentation
Compares electoral areas according to historical turnout patterns and changes.
Historical Trend Segmentation
Groups geographic areas according to comparable historical electoral patterns.
Vote Share Segmentation
Compares aggregate vote-share ranges or historical movement across geographic units.
Issue Research Segmentation
Compares recurring public issues across broad geographic areas using appropriate survey or field research.
Survey-Wave Segmentation
Compares aggregate survey findings across periods or appropriately defined research groups.
Geographic Voter Segmentation
Geographic segmentation is one of the most practical forms of election analysis because constituencies are already organized into defined geographic and administrative units.
Geographic units may include:
- Parliamentary constituency
- Assembly constituency
- Ward
- Village
- Locality
- Urban zone
- Rural area
- Polling area
Geographic analysis can help researchers compare electoral history, turnout, survey findings and public issues without assigning characteristics to specific individuals.
Demographic Information in Election Research
Broad demographic statistics may sometimes provide useful contextual information about a constituency when they come from appropriate sources and are analyzed at an aggregate level.
Examples can include:
- Broad population statistics
- Urban and rural distribution
- Publicly available census-style indicators
- Aggregate administrative statistics
Such data should be used cautiously. Researchers should avoid inferring an individual's political preference from age, gender, religion, caste, community or other sensitive personal characteristics.
Turnout-Based Segmentation
Historical turnout can be grouped and compared across geographic units to understand how participation has varied between elections.
Researchers may compare:
- Higher historical turnout areas
- Lower historical turnout areas
- Areas with stable turnout
- Areas with changing turnout
- Election-to-election turnout differences
Turnout patterns should not automatically be interpreted as political preference. Participation can change because of many administrative, social, geographic and election-specific factors.
Historical Electoral Segmentation
Historical election results can be grouped into broad analytical categories to understand geographic differences in previous election outcomes.
Researchers may compare:
- Historical vote-share ranges
- Winning-margin ranges
- Turnout ranges
- Changes between election cycles
- Candidate changes
- Alliance changes
These categories describe historical aggregate results. They should not be used as permanent labels for areas or as assumptions about current individual political preferences.
Issue-Based Segmentation
Political surveys and field research can identify recurring public issues within different geographic parts of a constituency.
Common issue categories may include:
- Roads and transport
- Water supply
- Electricity
- Employment
- Healthcare
- Education
- Agriculture
- Public infrastructure
- Civic services
- Other constituency-specific concerns
Issue segmentation is most responsible when findings are reported in aggregate form and are supported by an appropriate research methodology.
Voter Segmentation at Constituency Level
Constituency-level segmentation can combine several data layers to make broad electoral differences easier to understand.
It may combine:
- Constituency geography
- Ward structure
- Polling-area structure
- Electorate totals
- Historical turnout
- Historical election results
- Vote-share trends
- Political surveys
- Public issue research
- Field research
This type of analysis works closely with Constituency Profiling .
Booth-Level Segmentation
Polling-area data can provide a more granular geographic framework for aggregate election research.
Booth-level analysis may compare:
- Electorate totals
- Historical turnout
- Historical vote share
- Winning margins
- Changes across elections
- Field-research coverage
- Broad issue patterns
Booth-level results are aggregate electoral information and do not reveal how an individual elector voted.
Polling-station boundaries, numbering and voter allocation may also change between elections, so comparability should always be verified.
Explore: Booth Management
Election Research vs Official Polling Administration
Election Research
May analyze appropriate electoral data, historical results, geography, surveys and aggregated polling-area trends.
Official Election Administration
Electoral rolls, polling-station administration, voting procedures, polling personnel, election security and official results are handled by the relevant election authorities.
Voter Segmentation and Voter Data Analysis
Voter Segmentation is one analytical technique within the broader field of Voter Data Analysis.
Voter Data Analysis
Covers the broader process of collecting, cleaning, organizing, comparing and interpreting election-related data.
Voter Segmentation
Organizes selected aggregate data into meaningful analytical groups for comparison and reporting.
Explore: Voter Data Analysis Services
Voter Segmentation and Political Surveys
Political surveys can provide structured information about public opinion, issue priorities and candidate evaluations.
Where the research methodology supports it, survey findings can be compared across broad geographic or other legitimate analytical categories.
Researchers should ensure that:
- Sample sizes support the comparison
- Question wording is consistent
- Field dates are documented
- Weighting methods are transparent
- Small differences are not overinterpreted
- Sensitive personal profiling is avoided
Explore: Political Survey Services
Voter Segmentation and Election Trend Analysis
Election Trend Analysis provides historical context for segmentation by showing how electoral indicators have changed across election cycles.
Analysts may compare:
- Historical vote share
- Turnout
- Winning margins
- Party performance
- Candidate performance
- Geographic electoral patterns
Learn more: What is Election Trend Analysis?
Voter Segmentation and Vote Share Analysis
Vote share can be compared across geographic segments to understand differences in historical electoral performance.
For example, analysts may compare:
- Constituency vote share
- Ward-level aggregate results
- Polling-area aggregate results
- Election-to-election movement
- Historical margin changes
Vote-share patterns describe aggregate historical election outcomes and should not be treated as direct evidence of current individual political preference.
Voter Segmentation and Swing Analysis
Historical segmentation can identify geographic areas where aggregate electoral results have changed between election cycles.
Such changes may indicate a need for additional research, but election results alone cannot explain why the movement occurred.
Analysts may use:
- Historical results
- Political surveys
- Vote-share analysis
- Turnout analysis
- Candidate changes
- Local issue research
How Voter Segmentation is Conducted
What Makes a Good Segmentation Framework?
A useful segmentation system should be understandable, relevant and supported by the underlying data.
Good segments should generally be:
- Relevant to the research objective
- Based on reliable data
- Large enough for meaningful analysis
- Clearly defined
- Comparable across research periods where needed
- Easy to interpret
- Documented consistently
- Appropriate from a privacy perspective
Creating highly detailed categories without sufficient data can make analysis less reliable rather than more useful.
Data Quality in Voter Segmentation
Segmentation is only as reliable as the data used to create it.
Common data-quality checks include:
- Source verification
- Source date
- Dataset version
- Duplicate detection
- Missing values
- Geographic consistency
- Historical comparability
- Survey methodology
- Data transformation rules
- Audit documentation
Poor data can produce visually impressive but misleading segments.
Geographic Mapping and Voter Segmentation
Geographic visualization is particularly useful when a constituency contains several distinct urban, semi-urban or rural areas.
Maps can visualize:
- Constituency boundaries
- Ward boundaries
- Polling-area geography
- Electorate totals
- Historical turnout
- Historical vote share
- Election-result changes
- Survey coverage
- Aggregate public issue patterns
Role of Charts and Dashboards
Large electoral datasets can be difficult to understand when they are presented only as spreadsheets.
Visualization can include:
- Segment comparison charts
- Turnout charts
- Vote-share trends
- Historical comparison charts
- Constituency maps
- Polling-area maps
- Survey comparison charts
- Research dashboards
Visualizations should include enough context to prevent small or uncertain differences from appearing more significant than they are.
Technology Used in Voter Segmentation
Modern analytical systems can make large election datasets easier to manage and compare.
Technology may support:
- Database management
- Data cleaning
- Geographic mapping
- Statistical analysis
- Survey integration
- Historical comparison
- Dashboard generation
- Data visualization
- Quality-control checks
- Analytical reporting
AI-Assisted Voter Segmentation Analysis
AI-assisted tools can support selected data-processing and research tasks when used with human oversight.
Appropriate uses can include:
- Data-quality flagging
- Anomaly detection
- Research summarization
- Open-ended response categorization
- Historical comparison assistance
- Visualization support
- Document organization
AI does not remove methodological limitations and should not be used to infer or guarantee an individual's political preference.
Privacy and Data Governance in Voter Segmentation
Political research can involve information requiring careful handling, so segmentation projects should include data-governance controls from the beginning.
- Use appropriate and lawful data sources
- Define a legitimate analytical purpose
- Collect only necessary information
- Avoid unnecessary sensitive personal profiling
- Prefer aggregate reporting where appropriate
- Restrict access to authorized personnel
- Secure databases and data transfers
- Maintain appropriate retention controls
- Document analytical methodology
- Protect survey confidentiality
Benefits of Voter Segmentation
- Organizes large electoral datasets
- Improves geographic comparison
- Supports constituency research
- Improves turnout analysis
- Supports historical election analysis
- Improves interpretation of political surveys
- Supports booth-level aggregate research
- Improves data visualization
- Helps identify research gaps
- Supports structured analytical reporting
Challenges in Voter Segmentation
Outdated Data
Old datasets may no longer represent current electoral geography or electorate structure.
Boundary Changes
Constituency and polling-area changes can complicate historical comparison.
Small Groups
Segments that are too small may produce unstable or misleading findings.
Over-Segmentation
Creating too many categories can reduce interpretability and analytical reliability.
Incorrect Assumptions
Aggregate patterns may be incorrectly interpreted as describing every individual within an area.
Privacy Risk
Unnecessary personal or sensitive data can create privacy and governance concerns.
Best Practices for Voter Segmentation
- Start with a clear research objective
- Use reliable and appropriate data
- Verify dataset dates and versions
- Clean and standardize data
- Use meaningful aggregate segments
- Keep segment definitions documented
- Check sample size before survey comparisons
- Verify geographic comparability
- Avoid unnecessary sensitive profiling
- Use aggregate reporting where possible
- Explain analytical limitations
- Protect data access and confidentiality
Voter Segmentation vs Constituency Profiling
Voter Segmentation
Organizes selected electoral or research data into analytical groups for comparison.
Constituency Profiling
Develops a broader picture of an electoral constituency using geography, historical results, infrastructure, public issues and other research.
Segmentation can therefore form one component of a broader constituency-analysis framework.
Voter Segmentation vs Swing Voter Analysis
Voter Segmentation
Organizes aggregate electoral and research information into meaningful categories.
Swing Analysis
Focuses on changes or instability in aggregate political preferences and electoral patterns over time.
How Segmentation Supports Election Planning
Aggregate segmentation can provide structured research inputs for campaign and election-management teams.
Appropriate uses may include:
- Identifying research gaps
- Comparing geographic areas
- Planning additional survey coverage
- Understanding historical trends
- Reviewing field-research coverage
- Organizing management reports
- Comparing public issues geographically
- Supporting campaign monitoring
Segmentation should support research and operational understanding, not individualized persuasion based on sensitive personal characteristics.
Voter Segmentation and Election Campaign Management
Election campaign management combines research, operations, communication, field coordination, technology and monitoring.
Aggregate segmentation can provide analytical context for:
- Constituency research
- Field research
- Political surveys
- Booth-level aggregate analysis
- Historical trend research
- Issue analysis
- Campaign dashboards
- Management reporting
Explore: Election Campaign Management
How Professional Voter Segmentation Services Help
Election datasets may contain thousands or millions of records across multiple electoral and geographic levels.
Professional analytical support may include:
- Research-objective development
- Election-data collection
- Data cleaning
- Geographic structuring
- Historical result analysis
- Turnout segmentation
- Vote-share segmentation
- Survey integration
- Geographic mapping
- Dashboard development
- Data validation
- Analytical reporting
- Privacy and data-governance controls
Professional analysis should document what each segment represents, how it was created and what limitations apply.
Megamind's Voter Segmentation & Election Analytics Approach
Megamind approaches voter segmentation as part of a broader Election Data, Political Research and Constituency Intelligence Framework .
Our analytical process can follow:
Research Objective → Data Collection → Source Verification → Data Cleaning → Geographic Structuring → Aggregate Segmentation → Historical Comparison → Survey Integration → Data Validation → Visualization → Analytical Reporting
Depending on project requirements, segmentation can be integrated with Voter Data Analysis, Political Surveys, Constituency Analysis, Vote Share Analysis, Election Trend Analysis and Booth-Level Aggregate Research .
Megamind provides structured election-data and research support for political parties, candidates, leaders, prospective candidates, aspirants, campaign teams and political organizations across India.
Explore Voter Data Analysis Services →Voter Segmentation Within a Complete Election Research Framework
Segmentation is most useful when it is not treated as a standalone technique.
Electoral Data → Data Verification → Constituency Mapping → Aggregate Segmentation → Historical Results → Political Survey → Vote Share Analysis → Election Trend Analysis → Booth-Level Aggregate Research → Visualization → Analytical Reporting
Each analytical method answers a different question, and combining them carefully creates a more complete research picture.
FAQs About Voter Segmentation
1. What is voter segmentation?
Voter segmentation is an analytical technique used to organize electoral or survey information into meaningful groups for research and comparison.
2. Why is voter segmentation useful?
It makes large election datasets easier to compare and can reveal aggregate geographic, turnout, historical and survey differences that constituency-wide averages may hide.
3. What are the main types of voter segmentation?
Useful methods can include geographic, turnout, historical trend, vote-share, issue-research and survey-based aggregate segmentation.
4. Is voter segmentation the same as individual voter profiling?
No. Aggregate segmentation studies grouped electoral or research information, while individualized profiling attempts to assign characteristics to specific people.
5. What is geographic voter segmentation?
It organizes election research by geographic units such as constituencies, wards, villages, localities or polling areas.
6. Can turnout be used for segmentation?
Historical turnout can be compared across aggregate geographic areas, but turnout itself should not be treated as proof of political preference.
7. Can booth-level data be used?
Yes. Aggregate booth-level results can support geographic research when boundaries and historical comparability are carefully verified.
8. Does booth-level data reveal how a person voted?
No. Booth-level results are aggregate election outcomes and do not reveal an individual's secret ballot.
9. How do political surveys support voter segmentation?
Survey findings can be compared across appropriate aggregate categories when sample size and research methodology support the comparison.
10. What is the relationship between voter segmentation and voter data analysis?
Voter Data Analysis is the broader analytical process, while segmentation is one technique used to organize selected data into groups.
11. How is voter segmentation different from constituency profiling?
Segmentation groups selected electoral information, while constituency profiling builds a broader picture covering geography, electoral history, infrastructure, public issues and other research.
12. Can AI be used for voter segmentation?
AI can assist with data organization, quality checks, categorization and visualization, but analytical decisions and important conclusions require human review.
13. Why is privacy important in voter segmentation?
Election research can involve sensitive information, so projects should minimize unnecessary data collection, use appropriate access controls and avoid unnecessary individual political profiling.
14. Can voter segmentation predict election results?
No. Segmentation helps organize and analyze electoral patterns, but it does not guarantee a future election outcome.
15. Who can use professional voter segmentation services?
Political parties, candidates, leaders, prospective candidates, campaign teams and political organizations may use aggregate election-research and analytical services according to their legitimate project requirements.
Voter Segmentation Makes Complex Election Data Easier to Understand
Voter Segmentation is a useful analytical technique for organizing complex electoral information into understandable groups.
Professional segmentation can examine geography, historical turnout, vote share, electoral trends, public issues, political surveys and booth-level aggregate data to understand meaningful differences within a constituency.
Its value depends on reliable data, appropriate segment definitions, clear methodology, responsible interpretation and strong privacy practices.
The objective should not be to assign political characteristics to individual citizens. The strongest use of segmentation is aggregate election research, geographic analysis, historical comparison, visualization and structured analytical reporting .