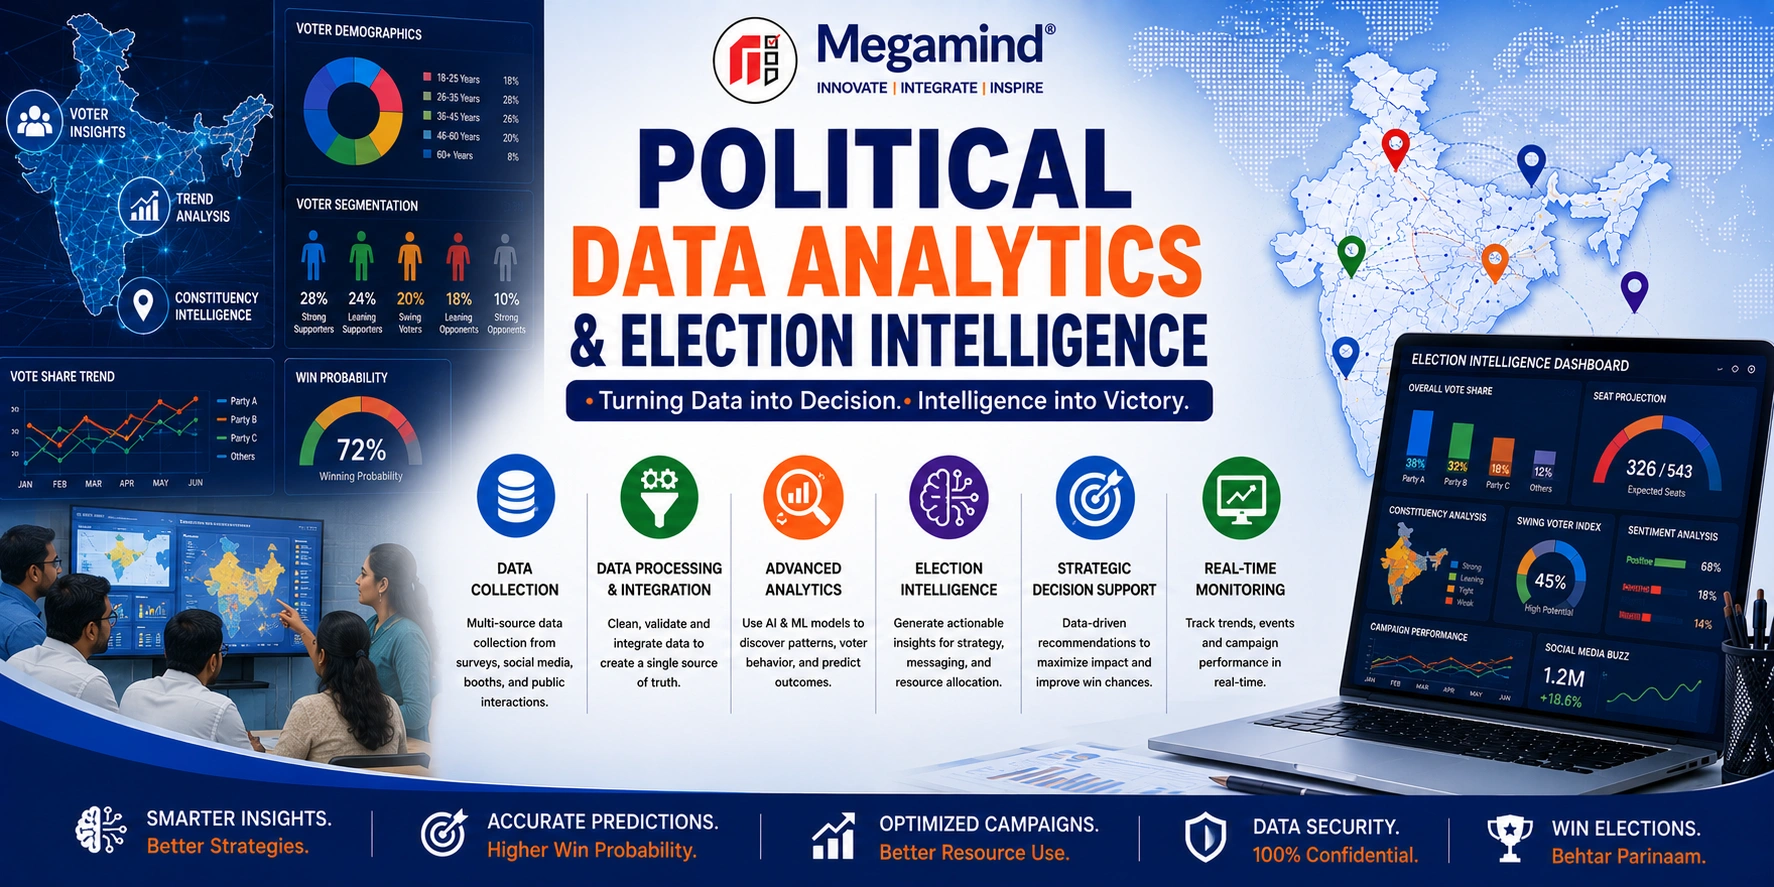
Political Data Analytics & Election Intelligence transforms complex electoral information into structured, understandable and actionable management intelligence. Megamind connects Election Data → Data Processing → Historical Analysis → Constituency Analysis → Aggregate Booth Trends → Political Research → Survey Analytics → Visualization → Reporting → Management Intelligence within one integrated election analytics framework.
What is Political Data Analytics & Election Intelligence?
Political Data Analytics is the structured process of collecting, cleaning, organizing, comparing and interpreting lawful political, electoral, constituency, survey and campaign information.
Election Intelligence is the management layer created from that analysis. It helps campaign leadership understand historical electoral performance, constituency conditions, aggregate geographic trends, political research findings and campaign developments in a systematic manner.
Political data becomes more useful when different datasets are connected and interpreted together rather than reviewed as isolated spreadsheets.
A comprehensive election analytics framework can combine:
- Historical election results
- Candidate performance
- Party performance
- Vote share
- Winning and losing margins
- Voter turnout
- Constituency-level trends
- Aggregate booth-level results
- Political survey findings
- Public issue research
- Candidate assessment
- Competitor analysis
- Campaign reporting
- Field intelligence summaries
- Digital and media monitoring summaries
- Election War Room dashboards
Election data alone is not election intelligence. Intelligence emerges when reliable data is properly structured, compared in context, interpreted with its limitations and converted into information that campaign leadership can understand and review.
Why Political Data Analytics Matters in Election Campaigns
Modern election campaigns can generate and receive large quantities of information from election results, research, surveys, constituency teams, campaign activities and public sources.
Without structured analytics, this information can remain fragmented across spreadsheets, reports, teams and communication channels.
Political Data Analytics creates a common analytical framework through which campaign leadership can examine electoral information consistently.
It can help management answer questions such as:
- How has constituency performance changed over time?
- How has party vote share changed?
- How competitive were previous elections?
- How have winning margins changed?
- How has aggregate turnout changed?
- Which geographic areas show changing aggregate patterns?
- How did different candidates perform historically?
- What does survey research indicate at an aggregate level?
- Where do historical results and current research differ?
- Which public issues are appearing in research?
- What information requires additional verification?
- Which indicators should campaign leadership monitor?
Our Political Data Analytics & Election Intelligence Services
Historical Election Analysis
Structured comparison of previous election results, party performance, candidates, vote share, turnout and winning margins.
Constituency Data Analysis
Integrated constituency-level review of electoral history, aggregate geographic patterns, research findings and political indicators.
Aggregate Booth Analysis
Analysis of lawful aggregate booth-level election results to understand geographic electoral patterns without identifying individual voting behavior.
Vote Share Analysis
Comparative analysis of candidate and party vote shares across elections and appropriate aggregate electoral units.
Turnout Analysis
Analysis of aggregate electoral participation and turnout changes across elections and geographic units.
Winning Margin Analysis
Comparative analysis of historical winning and losing margins to understand constituency competitiveness.
Candidate Performance Analytics
Structured assessment of publicly available historical candidate electoral performance.
Political Trend Analysis
Longitudinal comparison of electoral indicators to identify meaningful changes across election cycles.
Political Survey Analytics
Structured analysis of aggregate survey findings, public issues, candidate assessment and broader political environment.
Election Data Visualization
Conversion of complex electoral datasets into clear tables, charts, maps, dashboards and management summaries.
Campaign Intelligence Dashboard
Consolidated management view of approved aggregate election, research and campaign indicators.
Election Intelligence Reporting
Periodic analytical reports designed to help leadership understand major findings, changes, limitations and management priorities.
Building a Reliable Election Data Foundation
Analytical quality depends heavily on the quality and structure of the underlying data.
Election information can originate from different years, sources and formats. Constituency names, candidate names, party names, electoral units and field definitions may also change over time.
Before meaningful analysis begins, the data should therefore be reviewed, standardized and documented.
- Data source identification
- Election-year classification
- Constituency standardization
- Candidate-name standardization
- Party-name standardization
- Field-definition review
- Duplicate detection
- Missing-value review
- Data-type validation
- Result-total reconciliation
- Source documentation
- Version control
Election Data Cleaning, Standardization & Processing
Raw election data is rarely ready for immediate analytical comparison.
Data processing creates a consistent structure that allows different elections, constituencies and aggregate electoral units to be compared appropriately.
Historical Election Result Analysis
Historical election results provide an important factual baseline for understanding a constituency.
Instead of looking only at the most recent winner, historical analysis compares multiple electoral indicators across election cycles.
Depending on data availability, analysis can examine:
- Election year
- Winning candidate
- Winning party
- Runner-up candidate
- Candidate vote totals
- Party vote totals
- Vote share
- Winning margin
- Turnout
- Number of candidates
- Party performance changes
- Candidate performance changes
- Competitive structure
- Aggregate geographic changes
Historical patterns provide context, but they should not be treated as a guarantee of future electoral behavior.
Multi-Election Comparative Analysis
Comparing multiple elections can provide a more complete picture than analyzing a single result.
Multi-election analysis can highlight whether a result was part of a longer pattern or an exceptional election-specific outcome.
Vote Share Change
Compare candidate or party vote-share movement across different elections.
Margin Change
Examine how electoral competitiveness changed across election cycles.
Turnout Change
Compare aggregate electoral participation across different elections.
Candidate Change
Review how changes in candidates corresponded with publicly reported electoral outcomes.
Party Performance
Compare party-level electoral performance across election cycles.
Competitive Pattern
Understand whether the constituency historically shows close, variable or more stable aggregate contests.
Voter Turnout Analysis
Aggregate turnout analysis examines electoral participation across constituencies, elections or other appropriate geographic electoral units.
Turnout is an important contextual indicator because changes in participation can accompany changes in election outcomes.
Analysis can compare:
- Constituency turnout
- Election-year turnout
- Turnout percentage change
- Aggregate booth turnout
- High-participation areas
- Low-participation areas
- Turnout distribution
- Historical participation trends
Aggregate turnout statistics indicate participation levels; they do not reveal an individual's political preference or voting choice.
Winning Margin & Electoral Competitiveness Analysis
Winning margin analysis measures the difference between leading candidates and helps describe the historical competitiveness of an electoral contest.
Margin analysis can be particularly useful when compared across several elections.
- Winning margin in votes
- Margin as percentage
- Election-to-election margin change
- Winner versus runner-up comparison
- Close historical contests
- Large-margin historical contests
- Constituency competitiveness
- Volatility across election cycles
Constituency-Level Political Data Analytics
Constituency intelligence combines multiple analytical dimensions to create a consolidated view of an electoral constituency.
Rather than reviewing historical results, survey research, candidate information and campaign reporting separately, constituency analytics can organize them within one management framework.
- Historical election performance
- Party performance
- Candidate performance
- Vote-share trends
- Winning margins
- Aggregate turnout
- Aggregate geographic trends
- Political survey findings
- Public issue research
- Candidate assessment
- Competitor analysis
- Campaign reporting
Explore: Constituency Analysis
Aggregate Booth-Level Election Data Analysis
Where lawful and reliable aggregate booth-level election results are available, they can provide greater geographic detail than constituency totals alone.
Aggregate booth analytics can compare officially reported or otherwise lawfully available totals such as votes received, turnout and historical electoral performance.
This analysis can help describe geographic electoral patterns without attempting to determine how an identifiable individual voted.
- Aggregate booth result comparison
- Booth turnout comparison
- Historical aggregate vote-share change
- Geographic result patterns
- Election-to-election movement
- Aggregate performance distribution
- Data completeness review
- Map-based visualization where appropriate
Booth-level election results are aggregate electoral totals. They do not reveal how any identifiable voter cast a ballot. Megamind's analytics framework treats aggregate election results as geographic and electoral statistics rather than as individual political-preference records.
Historical Candidate Performance Analysis
Candidate performance analytics organizes publicly available historical election information relating to candidates.
Depending on available data, the analysis can examine:
- Previous elections contested
- Historical vote totals
- Historical vote share
- Winning or losing margins
- Party affiliation by election
- Election-to-election performance
- Constituency-level performance history
- Comparative candidate performance
Historical candidate results provide factual electoral context but do not by themselves determine future performance.
Competitor Analysis & Election Intelligence Integration
Election Intelligence can incorporate lawful public information relating to competing candidates and political parties.
Historical electoral performance, public campaign activity, candidate background and broader constituency competition can be analyzed within a structured comparative framework.
Explore: Political Competitor Analysis
Political & Election Trend Analysis
Trend analysis studies how electoral indicators change over time.
Instead of treating each election as an isolated event, the analytical process compares multiple elections to identify persistent, changing or volatile aggregate patterns.
Party Trend
Historical change in aggregate party electoral performance.
Candidate Trend
Comparison of candidate electoral performance across relevant previous contests.
Vote Share Trend
Changes in aggregate vote share across election cycles.
Turnout Trend
Historical changes in aggregate electoral participation.
Margin Trend
Changes in winning margins and constituency competitiveness.
Geographic Trend
Changes in aggregate electoral performance across appropriate geographic units.
Political Survey Data & Election Analytics Integration
Historical election results describe previous elections. Political surveys can provide a structured snapshot of current aggregate public opinion when they are properly designed and executed.
Combining these sources can provide campaign leadership with broader analytical context.
Aggregate survey analytics can include:
- Candidate awareness
- Aggregate candidate assessment
- Public issue priorities
- Campaign awareness
- Leadership assessment
- Broad political environment
- Constituency-level research summaries
- Wave-to-wave survey comparison
Survey results should always be interpreted according to methodology, sample design, fieldwork quality, timing, question wording and statistical limitations.
Respondent confidentiality should be maintained, and aggregate survey research should not be converted into sensitive political-preference profiles of identifiable individuals.
Explore: Political Survey Services
Historical Election Data vs Current Political Research
Historical Election Data
Describes officially reported or otherwise reliable past electoral outcomes such as vote totals, vote share, turnout, candidates and margins.
Current Political Research
Provides a time-specific research view of current public issues, awareness and other measured indicators subject to survey methodology and limitations.
These sources answer different questions and should not be treated as interchangeable.
Election Intelligence becomes more useful when each source is interpreted according to what it can—and cannot—reliably establish.
Public Issue Research & Analytical Reporting
Public issues can be incorporated into Election Intelligence when they are derived from appropriate research, documented field reporting or reliable public sources.
Issue analysis can organize:
- Issue category
- Research source
- Geographic context
- Survey frequency
- Field reporting frequency
- Change over time
- Verification status
- Management review status
The purpose of issue analytics is to improve structured understanding and reporting, not to infer sensitive individual political characteristics.
Geographic Election Data Analysis & Mapping
Electoral information can become easier to understand when aggregate geographic patterns are visualized.
Where suitable data and geographic boundaries are available, election analytics can be presented through maps and geographic summaries.
- Constituency maps
- Aggregate booth-result maps
- Vote-share visualization
- Turnout visualization
- Winning-margin visualization
- Historical change maps
- Aggregate performance distribution
- Research summary maps where methodologically appropriate
Geographic visualization should preserve the aggregate nature of electoral data and should not be interpreted as revealing an individual's vote.
Election Data Visualization
Large spreadsheets can make important patterns difficult for campaign leadership to identify quickly.
Data visualization converts complex analytical information into formats that are easier to review.
Tables
Structured comparative election and constituency summaries.
Charts
Clear visual presentation of vote share, turnout, margins and historical trends.
Maps
Geographic presentation of appropriate aggregate electoral indicators.
Dashboards
Consolidated management views combining multiple approved indicators.
Trend Lines
Longitudinal visualization of electoral changes across election cycles.
Executive Summaries
Condensed analytical findings designed for campaign leadership review.
Political Intelligence & Election Analytics Dashboard
An election intelligence dashboard can consolidate approved analytical indicators within one management interface.
Depending on project requirements, dashboard modules can include:
- Historical election summary
- Candidate performance
- Party performance
- Vote-share trends
- Winning-margin trends
- Turnout trends
- Constituency comparison
- Aggregate booth trends
- Political survey summaries
- Public issue summaries
- Campaign reporting
- Management alerts
- Data update status
- Source information
Election Intelligence KPI & Indicator Framework
A useful election intelligence system should distinguish between different types of indicators rather than mixing them into a single score without context.
Depending on the project, management indicators can be grouped into:
Historical Indicators
Previous vote share, margins, turnout and candidate or party performance.
Research Indicators
Aggregate findings from properly designed political surveys and research.
Operational Indicators
Approved campaign activity and reporting metrics used for management monitoring.
Data Quality Indicators
Completeness, freshness, source status and validation information.
Issue Indicators
Aggregate research or verified reporting relating to public issues.
Management Indicators
High-level summaries prepared for campaign leadership and War Room review.
Election Intelligence Reports for Campaign Leadership
Political analytics should ultimately produce information that campaign management can understand and use.
Reports can be structured according to project requirements and reporting frequency.
- Constituency analytical report
- Historical election report
- Vote-share report
- Turnout report
- Winning-margin report
- Candidate performance report
- Competitor analysis summary
- Political survey analytical report
- Trend analysis report
- Aggregate geographic analysis
- Management dashboard
- Executive intelligence summary
Political Data Analytics & Election War Room Integration
An Election War Room can serve as the operational environment where different streams of approved campaign information are consolidated for management review.
Political Data Analytics can support the War Room by providing standardized dashboards and reports rather than disconnected raw datasets.
- Historical election intelligence
- Constituency analytical summaries
- Survey findings
- Field reporting summaries
- Public issue summaries
- Campaign activity reports
- Data-quality status
- Management indicators
- Periodic comparison reports
- Executive review dashboards
Explore: Election War Room Management
Political Data Analytics & Election Strategy Planning
Election strategy is stronger when assumptions can be compared with reliable evidence.
Political Data Analytics can provide campaign leadership with factual historical context, current aggregate research and structured operational reporting.
Analytics does not replace political judgment. Instead, it provides a more organized evidence base for strategic discussion and review.
Explore: Election Strategy & Planning
Campaign Monitoring Data & Management Intelligence
Election Intelligence can extend beyond historical election analysis by incorporating approved operational campaign reporting.
Depending on project scope, management can review aggregate campaign information relating to:
- Campaign activity status
- Field reporting completion
- Public program status
- Outreach activity summaries
- Issue-reporting status
- Communication activity
- Digital monitoring summaries
- Media monitoring summaries
- Pending management actions
- Reporting compliance
Operational metrics should be clearly distinguished from measures of public opinion or voting intention.
Election Data Quality & Validation Framework
Attractive dashboards cannot compensate for unreliable or poorly structured data.
Megamind's analytical approach can include appropriate quality-control steps before important conclusions are presented.
Correlation, Patterns & Political Interpretation
Election datasets can contain many apparent relationships, but not every relationship establishes causation.
For example, two electoral indicators may change at the same time without one necessarily causing the other.
Political analytics should therefore distinguish between:
- Observed data
- Calculated indicators
- Historical patterns
- Survey estimates
- Analytical interpretation
- Unverified assumptions
- Scenario analysis
- Future uncertainty
This distinction helps campaign leadership understand the strength and limitations of analytical conclusions.
Election Scenarios, Forecasting & Analytical Limitations
Historical results, current research and analytical models can be used to explore possible electoral scenarios.
However, elections are dynamic events affected by candidate changes, alliances, campaign developments, turnout, public issues, late political events and many other factors.
Therefore, analytical scenarios should be presented with assumptions and limitations rather than as guaranteed future outcomes.
Professional Election Intelligence should help leadership understand uncertainty—not hide it.
Political Data Privacy, Security & Responsible Analytics
Political and election projects can involve public election data, research datasets, survey responses, campaign reports and other information with different confidentiality and governance requirements.
Megamind's framework emphasizes appropriate and lawful data handling.
- Lawful data sources
- Defined analytical purpose
- Data minimization
- Appropriate access controls
- Secure project storage
- Survey respondent confidentiality
- Aggregate reporting
- Appropriate retention practices
- Data-source documentation
- Version management
- Responsible analytical interpretation
- Avoidance of unnecessary sensitive personal profiling
Aggregate election results and constituency statistics should not be used to claim knowledge of an identifiable individual's secret ballot.
Aggregate Political Analytics vs Individual Political Profiling
Aggregate Election Analytics
Examines election results, turnout, vote share, survey summaries and other appropriate indicators at constituency, geographic or other aggregate levels.
Individual Political Profiling
Attempts to assign political preferences or sensitive political characteristics to identifiable people. Megamind's aggregate Election Intelligence framework does not require such profiling.
Aggregate analysis can provide substantial campaign intelligence while maintaining a clear distinction between geographic electoral statistics and individual political preference.
Digital Metrics vs Political Survey Data
Digital metrics such as views, likes, shares, comments and follower growth can be useful for evaluating digital communication activity.
They should not automatically be interpreted as representative public opinion, constituency vote share or election results.
Digital Analytics
Measures activity occurring on digital platforms and authorized campaign channels.
Political Survey Research
Uses a defined research methodology and sample to estimate aggregate public opinion, subject to statistical and methodological limitations.
Political Data Analytics & Election Intelligence Workflow
From Raw Election Data to Management Intelligence
Megamind combines Election Data + Data Processing + Historical Analysis + Constituency Analysis + Aggregate Booth Analytics + Political Survey Research + Competitor Analysis + Data Visualization + Campaign Reporting + Election War Room Integration within one structured Political Data Analytics framework.
Our broad analytical process can follow:
Define → Collect → Clean → Standardize → Validate → Analyze → Compare → Visualize → Interpret → Report → Monitor → Review
The exact analytical model depends on election type, constituency, available data, research methodology, campaign stage and agreed project scope.
Discuss Election Intelligence Requirements →Political Data Analytics & Election Intelligence Deliverables
Deliverables can be customized according to available data, election type, constituency, analytical objectives, campaign stage and management requirements.
A comprehensive engagement can include:
- Election Data Inventory
- Cleaned Election Dataset
- Historical Election Analysis
- Multi-Election Comparative Report
- Constituency Intelligence Report
- Aggregate Booth Analysis
- Vote Share Analysis
- Turnout Analysis
- Winning Margin Analysis
- Candidate Performance Analysis
- Party Performance Analysis
- Political Trend Analysis
- Competitor Intelligence Summary
- Political Survey Analytics
- Public Issue Research Summary
- Geographic Election Visualization
- Election Charts & Tables
- Political Intelligence Dashboard
- Management KPI Framework
- Election War Room Dashboard Integration
- Periodic Analytical Reports
- Executive Intelligence Summary
- Data Quality Report
- Methodology & Limitation Notes
- Final Election Intelligence Report
Election Intelligence for Different Project Levels
Constituency Project
Detailed analytical framework for a specific Assembly or other electoral constituency.
Multi-Constituency Project
Comparative analytics across multiple constituencies using consistent analytical definitions.
Parliamentary Project
Integrated analysis covering relevant constituency and aggregate electoral information.
State-Level Project
Broader electoral analysis and constituency comparison according to data availability and scope.
Campaign War Room
Continuous integration of approved analytical and operational reporting into management dashboards.
Research Project
Specialized analysis combining historical election data with aggregate political research.
Who Can Use Political Data Analytics & Election Intelligence?
- Political candidates
- Prospective candidates
- Political leaders
- Political parties
- Campaign management teams
- Election research teams
- Political organizations
- Election War Room teams
Benefits of Structured Election Intelligence
A structured Political Data Analytics system can improve the way campaign leadership organizes and interprets electoral information.
- Better organization of election data
- Clear historical context
- Consistent analytical definitions
- Improved constituency understanding
- Clear vote-share comparisons
- Better turnout interpretation
- Structured margin analysis
- Integrated survey reporting
- Better visualization
- Centralized dashboards
- Faster management review
- Clearer analytical limitations
Common Challenges in Political Data Analytics
Election data analysis can become misleading when datasets are incomplete, inconsistent or interpreted without context.
Common challenges include:
- Inconsistent historical formats
- Changing constituency boundaries
- Candidate-name variations
- Party-name changes
- Incomplete aggregate data
- Missing source documentation
- Mixing incomparable elections
- Ignoring turnout differences
- Overinterpreting small changes
- Treating correlation as causation
- Using online metrics as public opinion
- Treating projections as guaranteed outcomes
Customized Political Data Analytics Projects
Every election analytics project has different data availability, research requirements and management objectives.
Megamind therefore structures Election Intelligence projects according to the actual electoral and analytical context.
Project design can vary according to:
- Election type
- Constituency
- Number of constituencies
- Available historical data
- Aggregate booth-data availability
- Political survey availability
- Research requirements
- Campaign stage
- Reporting frequency
- Dashboard requirements
- War Room integration
- Project duration
Why Megamind for Political Data Analytics & Election Intelligence?
Megamind combines political research, election data processing, constituency analysis and campaign-management understanding within a single analytical framework.
This allows election analytics to connect with broader campaign requirements instead of remaining isolated as a purely technical data exercise.
- Political research understanding
- Election data processing
- Historical result analysis
- Constituency analytics
- Aggregate booth analytics
- Vote-share analysis
- Turnout analysis
- Political survey integration
- Competitor analysis integration
- Election dashboards
- War Room integration
- Responsible aggregate analytics
Election Intelligence can improve analytical clarity, reporting and evidence-based campaign management, but no analytical service can guarantee an election outcome.
FAQs About Political Data Analytics & Election Intelligence
1. What is Political Data Analytics & Election Intelligence?
Political Data Analytics & Election Intelligence is the structured collection, organization, analysis and interpretation of lawful election, constituency, survey and campaign data to support political research, campaign planning, monitoring and management decisions.
2. What services are included in Political Data Analytics?
Services can include historical election result analysis, constituency analysis, aggregate booth analysis, vote share trends, turnout analysis, winning margin analysis, candidate performance analysis, political survey integration, dashboards, campaign reporting and comparative election intelligence.
3. Does Megamind provide Political Data Analytics services across India?
Yes. Megamind can structure Political Data Analytics and Election Intelligence projects for elections and constituencies across India according to data availability, project requirements and agreed scope.
4. What is historical election data analysis?
Historical election data analysis compares previous election results to understand vote share, turnout, winning margins, candidate performance, party performance and changes in the electoral environment over time.
5. Can Megamind analyze constituency-level election data?
Yes. Constituency-level analysis can combine historical election results, vote share, turnout, winning margins, candidate performance, aggregate geographic trends, survey findings and other relevant lawful data.
6. What is aggregate booth-level election analysis?
Aggregate booth-level analysis examines officially reported or otherwise lawfully available booth-level totals and trends. Such aggregate results describe geographic electoral patterns and do not reveal how any identifiable individual voted.
7. What is vote share analysis?
Vote share analysis examines the percentage of valid votes received by parties or candidates and compares those shares across elections, constituencies or other appropriate aggregate electoral units.
8. What is voter turnout analysis?
Voter turnout analysis examines aggregate participation levels across elections or geographic units to understand how electoral participation has changed over time.
9. What is winning margin analysis?
Winning margin analysis studies the difference between leading candidates in previous elections to understand the historical competitiveness and volatility of an electoral contest.
10. Can political survey data be integrated with election analytics?
Yes. Properly designed aggregate survey findings can be analyzed alongside historical election data and constituency indicators, while preserving respondent confidentiality and respecting methodology limitations.
11. Can Election Intelligence predict election results with certainty?
No. Election analytics can identify patterns, trends and scenarios, but elections are dynamic and uncertain. Historical data, surveys or analytical models cannot guarantee a future election result.
12. Can Megamind create election dashboards?
Yes. Depending on project scope, Megamind can organize election intelligence into management dashboards covering historical results, vote share, turnout, margins, survey findings, campaign reporting and other approved aggregate indicators.
13. What is political trend analysis?
Political trend analysis compares electoral and research indicators across time to identify meaningful changes in party performance, candidate performance, participation, competitiveness and the broader constituency environment.
14. Can candidate performance be analyzed?
Yes. Candidate performance can be evaluated using lawful aggregate election results, previous contests, vote share, winning or losing margins and other relevant public electoral indicators.
15. Can competitor performance be included in Election Intelligence?
Yes. Public and lawful information about competing candidates, parties, historical performance and campaign environment can be incorporated into broader election intelligence analysis.
16. What is election data visualization?
Election data visualization converts complex electoral information into understandable charts, tables, maps, dashboards and management summaries to support interpretation and decision-making.
17. Can Political Data Analytics support Election Strategy & Planning?
Yes. Aggregate election analytics can provide evidence for strategic planning by helping campaign leadership understand historical performance, constituency conditions, survey findings and operational indicators.
18. Can Election Intelligence integrate with an Election War Room?
Yes. Election dashboards, survey summaries, field reporting and approved campaign indicators can be consolidated within an Election War Room for structured monitoring and management review.
19. Can Political Data Analytics be customized for an Assembly constituency?
Yes. Projects can be customized for Assembly constituencies according to available election data, research requirements, campaign stage and agreed analytical scope.
20. Can Election Intelligence be used for Parliamentary elections?
Yes. Election Intelligence can be structured for Parliamentary, Assembly and local elections according to project scale, available data and campaign requirements.
21. How is election data quality checked?
Data quality can be reviewed through source documentation, field definitions, consistency checks, duplicate checks, missing-value review, reconciliation and appropriate analytical validation.
22. Does aggregate booth data reveal how an individual voted?
No. Aggregate booth election results represent combined totals for an electoral unit and do not identify how a particular individual voted.
23. How does Megamind approach political data privacy?
Megamind's framework emphasizes lawful data sources, purpose limitation, appropriate access controls, data minimization, confidentiality of survey respondents and aggregate analysis rather than unnecessary sensitive personal political profiling.
24. Can Political Data Analytics integrate with full Election Campaign Management?
Yes. Political Data Analytics can support Election Campaign Management through research, constituency analysis, survey integration, monitoring dashboards, reporting and structured decision-support intelligence.
25. Does Political Data Analytics guarantee election victory?
No. Political Data Analytics can improve understanding, reporting and evidence-based campaign management, but election outcomes are determined by voters and many changing political, social and campaign factors.
Turning Election Data into Structured Political Intelligence
Political campaigns can have access to substantial amounts of electoral information without necessarily having a clear system for understanding it.
Political Data Analytics & Election Intelligence creates that system by connecting historical election results, constituency analysis, aggregate booth trends, vote share, turnout, winning margins, political research, survey findings, visualization and campaign reporting.
Megamind's objective is to transform complex election data into clear, structured and responsibly interpreted management intelligence while maintaining appropriate distinctions between historical facts, survey estimates, operational metrics, analytical interpretations and future uncertainty.
Transform Election Data into Structured Political Intelligence with Megamind
Discuss your election, constituency, historical data, political research, analytics, dashboard and Election Intelligence requirements with Megamind.
Discuss Political Data Analytics